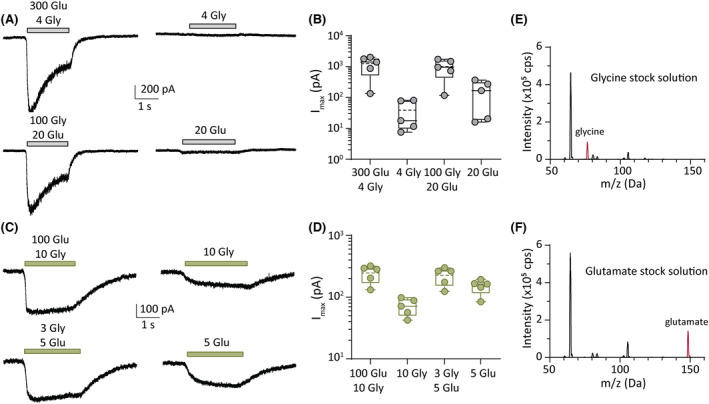
FIGURE 4.

Activation of GluN1(Y668H)/2A by single neurotransmitter. (A) Representative whole‐cell currents in response to the indicated micromolar concentrations of agonists (left) and single agonist (right) for wild‐type (WT) GluN1/2A receptors. (B) Quantification of peak currents from group data showing peak currents from agonist combinations compared to single agonists for WT receptors. (C) Representative whole‐cell currents in response to the indicated micromolar concentrations of agonists (left) and a single agonist (right) for GluN1(Y668H)/2A variant receptors. (D) Quantification of peak currents from group data showing peak currents from agonist combinations compared to single agonists for GluN1(Y668H)/2A variant receptors. (E, F). Mass spectra of the agonist stock solutions used in this study. The glycine stock (E) shows a clear peak at the glycine molecular mass of 75.07 g mol−1 (red peak), whereas the glutamate stock (F) shows a peak at the molecular mass of glutamate of 147.13 g mol−1 (red peak). Note that the plots in E and F show additional peaks that correspond to other masses in the extracellular solution.
