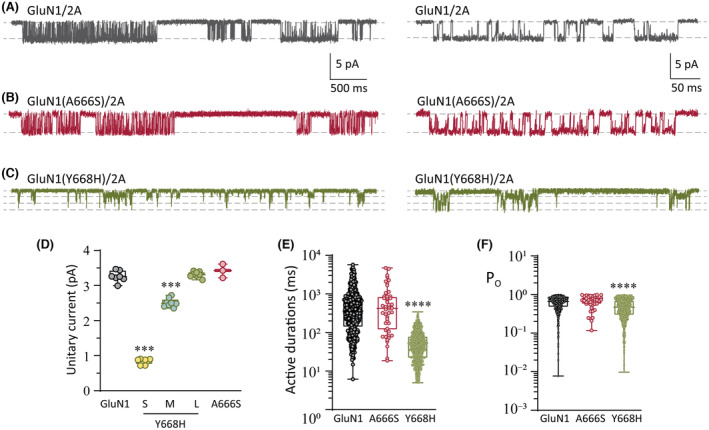
FIGURE 5.

Single‐receptor currents. (A–C) Representative single‐receptor currents recorded from excised outside‐out membrane patches expressing the WT GluN1/2A (A), GluN1(A666S)/2A (B), and GluN1(Y668H)/2A (C). Expanded views of single‐receptor activity are shown on the left. (D) Quantification of unitary current for the indicated receptors. Note that the GluN1(Y668H)/2A variant receptors have a wild‐type‐like amplitude (large [L]) and two smaller amplitudes (small [S] and medium [M]). (E) Plots of discrete activations (active periods) of single‐receptor current for the indicated receptors. (F) Plots of the open state occupancy (PO) within active periods for the indicated receptors. ***p < .001, ****p < .0001.
