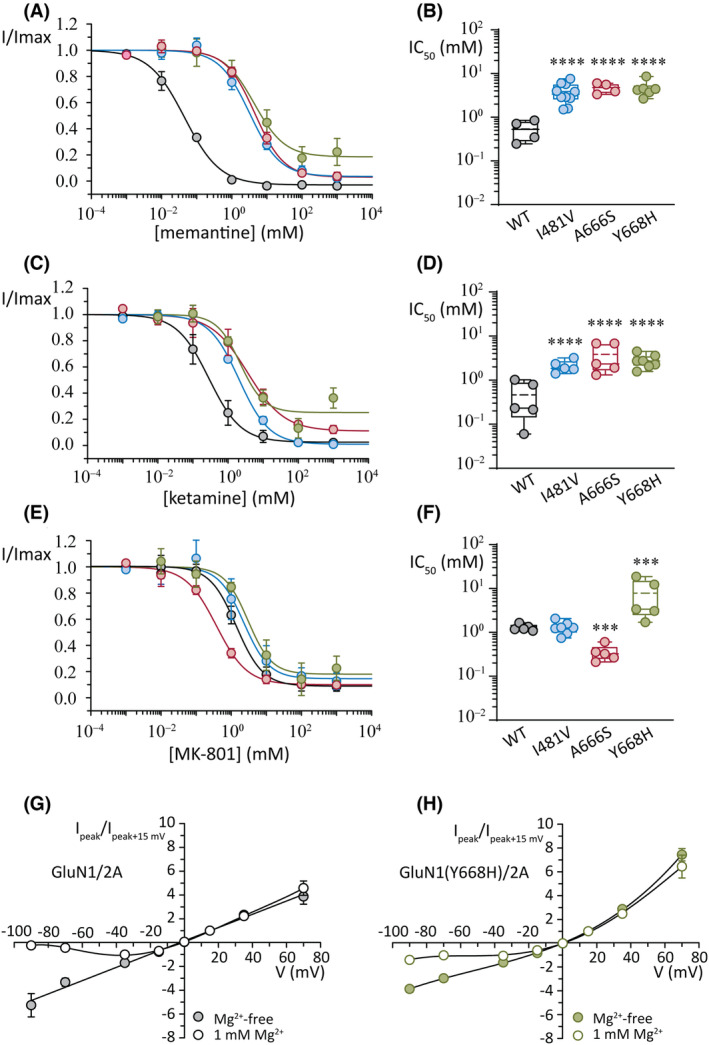
FIGURE 6.

Effects of open channel blockers. (A, B) Concentration–response plots for peak current (A) and summary of the half‐maximal inhibitory concentration (IC50) values (B) for the inhibition by memantine. (C, D) Concentration–response plots for peak current (C) and summary of the IC50 values (D) for the inhibition by ketamine. (E, F) Concentration–response plots for peak current (E) and summary of the IC50 values (F) for the inhibition by MK‐801. Currents were obtained at a holding potential of −100 mV. (G) Normalized whole‐cell current–voltage plots for wild‐type (WT) GluN1/2A receptors in the absence (filled circles) and presence (open circles) of extracellular Mg2+ ions (1 mmol·L−1). Note the block of current at negative voltages in 1 mmol·L−1 Mg2+. (H) Normalized whole‐cell current–voltage plots for GluN1(Y668H)/2A variant receptors in the absence (filled circles) and presence (open circles) of extracellular Mg2+ ions (1 mmol·L−1). Note the impaired block at negative voltages in 1 mmol·L−1 Mg2+ and the greater relative outward current compared to WT receptors. Currents were normalized to +15 mV. ***p < .001, ****p < .0001.
