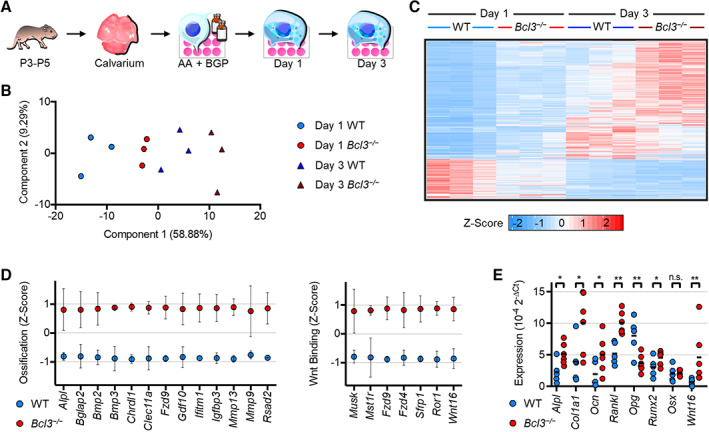
Figure 2.

RNA sequencing transcriptomic profiling of wild‐type (WT) and Bcl3 −/− osteoblasts on day 1 and day 3 following osteogenic induction. A, Schematic representation of experimental procedure. Following confluence, neonatal calvarial osteoblasts were treated with 50 μg/ml of L‐ascorbic acid (AA) and 2mM β‐glycerophosphate (BGP) to induce osteogenesis. B, Principal component analysis of all replicates along principal components 1 and 2. C, Heatmap of all replicates illustrating genes significantly different in WT and Bcl3 −/− cells. Adjusted P < 0.05, n = 3. D, Mean expression per gene Z scores of ossification and Wnt‐protein binding/Wnt gene sets identified via gene ontology analysis of up‐regulated genes in Bcl3 −/− cells on day 1. Error bars denote SD. E, Expression of select osteoblast genes on day 1 determined via quantitative polymerase chain reaction: alkaline phosphatase tissue‐nonspecific isozyme (Alpl), collagen type I a‐1 (Col1a1), osteocalcin (Ocn), Rankl, osteoprotegerin (Opg), Runt‐related transcription factor 2 (Runx2), osterix (Osx), and Wnt16. n = 5–6. DESeq2 outputs (B and C) and Fisher's least significant difference test (E) were used. n.s., not significant. * P < 0.05; ** P < 0.01.
