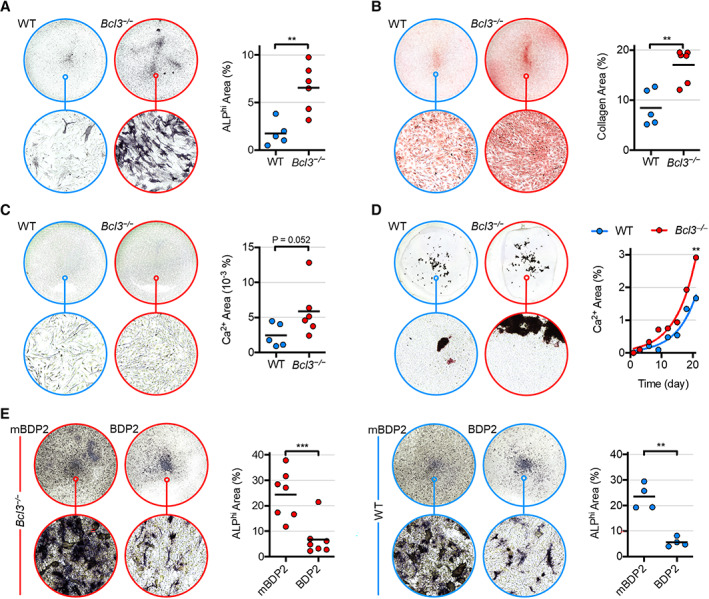
Figure 3.

Characterization of wild‐type (WT) and Bcl3 −/− osteoblast function following osteogenic induction and rescue/overexpression via BCL3 mimetic peptide. Osteogenesis was induced with 50 μg/ml of L‐ascorbic acid and 2 mM β‐glycerophosphate. A–C, Osteoblast production of alkaline phosphatase (ALP) (A), collagen (B), and calcium mineral micronodules (C) on day 1. Complete‐well representative images are of group medians (top; diameter = 22 mm) and the indicated magnified region (bottom; diameter = 182 μm), accompanied by pixel quantification. C, Enhanced sharpness and contrast in representative images. n = 5 (WT) and 6 (Bcl3 −/− ). D, Calcium mineral nodule production until day 21, with mean values superimposed per 3‐day interval. The curve fitted to the exponential equation using least squares fit and means is shown. n = 40. E, ALP expression in WT and Bcl3 −/− neonate calvarial osteoblasts under osteogenic differentiation until day 3 and treated with 30 μM control peptide (mutated BDP2) or BCL3 mimetic peptide (BDP2). Complete‐well representative images are of group medians (top; diameter = 15.6 mm) and the indicated magnified region (bottom; diameter = 182 μm), accompanied by pixel area quantification. n = 4–7. The Mann‐Whitney test (A–C), extra sum‐of‐squares F test (D), and paired t‐test (E) were used. * P < 0.05; ** P < 0.01; *** P < 0.001.
