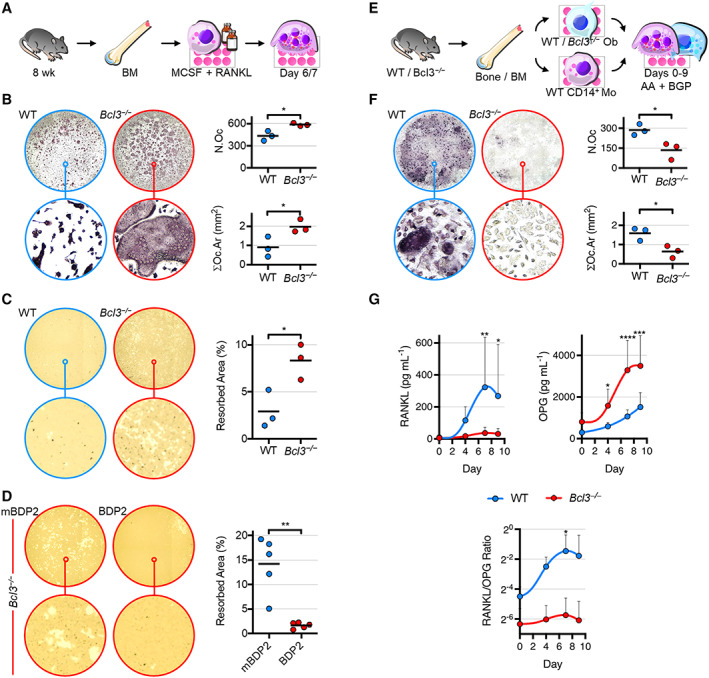
Figure 4.

Characterization of osteoclastogenic differentiation and function of wild‐type (WT) and Bcl3 −/− cells. A, Bone marrow (BM)–derived nonadherent cells were stimulated with 30 ng/ml of macrophage colony‐stimulating factor (M‐CSF) overnight and supplemented with 50 ng/ml of M‐CSF and RANKL until day 6 or 7. B, Tartrate‐resistant acid phosphatase (TRAP)–stained mature osteoclasts (≥3 nuclei) on day 6. N.Oc, osteoclast number; ∑Oc.Ar, total osteoclast area. n = 3. C, Resorption activity of osteoclasts cultured on mineral substrate until day 7. Lighter areas indicate resorbed mineral. n = 3. D, Resorption activity of Bcl3 −/− osteoclasts under osteoclastogenic differentiation until day 7 and treated with 30 μM control peptide (mutated BDP2) or BCL3 mimetic peptide (BDP2). n = 5. E, WT or Bcl3 −/− (from a Bcl3 −/− ::p53 fl /− strain) osteoblasts were cocultured with WT CD14+ monocytes in osteogenic medium up to 9 days. F, TRAP‐stained osteoclast number and area on day 9. n = 3. G, Supernatant levels of RANKL and osteoprotegerin (OPG). n = 5–6. Representative complete‐well (top; diameter = 6.4 mm) and magnified (bottom; diameter = 182 μm) images are of medians (B–F). Student's t‐test (B–C and F) and the paired t‐test (D) were used. Two‐way analysis of variance with Fisher's least significant difference multiple comparison (G) was used. * P < 0.05; ** P < 0.01; *** P < 0.001; **** P < 0.0001.
