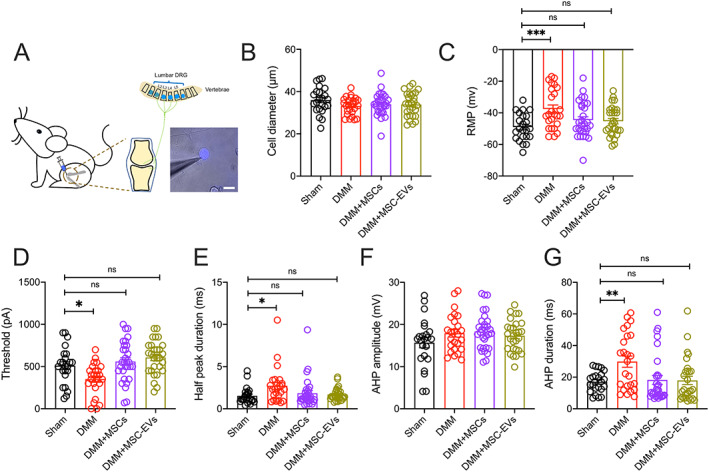
Figure 3.

Characteristics of knee‐innervating dorsal root ganglion (DRG) neurons assessed in mice from each group using retrograde fast blue labeling of knee joints (A; bar = 50 μm), with electrophysiology studies comparing diameter (B), resting membrane potential (RMP) (C), threshold of electrical stimulus required for action potential (AP) firing (D), half peak duration (E), afterhyperpolarization (AHP) amplitude (F), and AHP duration (G). Symbols represent individual DRG neurons; bars with whiskers show the mean ± SEM. * = P < 0.05; ** = P < 0.01; *** = P < 0.001 versus sham by one‐way ANOVA followed by Tukey's post hoc test. ns = no significant difference (see Figure 1 for other definitions). Color figure can be viewed in the online issue, which is available at http://onlinelibrary.wiley.com/doi/10.1002/art.42353/abstract.
