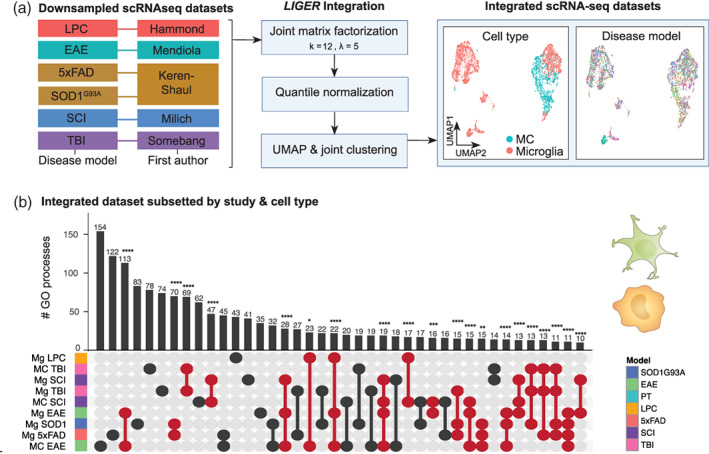
FIGURE 4.

Single‐cell RNA‐sequencing integration workflow with LIGER. (a) Myeloid cells from six disease models from five separate studies were integrated using LIGER. Data sets were downsampled prior to integration to ensure equal representation across disease models (469 microglia from each six disease models, 469 MCs from EAE, TBI, and SCI). Optimal k and lambda values were determined prior to clustering (Figure S1). Datasets were then integrated with LIGER and subjected to joint matrix factorization (k = 12, lambda = 5), quantile normalization, dimensionality reduction and joint clustering (data set alignment = 0.878). UMAPs of the LIGER‐integrated dataset show representation of both cell types intermixed across the six disease models. (b) UpSet plot showing overlap in the number of enriched GO terms for microglia and/or MCs from six disease models from the LIGER‐integrated dataset. GO term enrichment was performed on the differentially expressed genes on pseudo‐bulk cell populations from each disease versus every other disease. Samples are colored by disease‐model membership and arranged in order of increasing to decreasing number of biological processes associated with each population. Populations that share GO terms are indicated by connecting lines in the dot plot. Individual populations are indicated by a singular dark circle with no intersecting lines. Significant intersections are shown in red and were determined using the SuperExact test.
