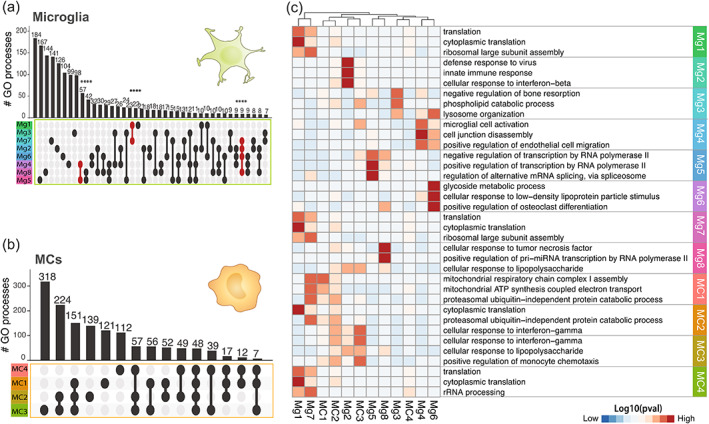
FIGURE 6.

Differing proportions of unique myeloid subtypes drive disease‐specific signatures in bulk populations. (a and b) UpSet plot showing overlap in the number of enriched GO terms for each of the (a) eight microglia (n = 2814 single cells) or (b) four MC (n = 1407 single cells) clusters identified in the LIGER‐integrated scRNA‐seq dataset from six disease models. GO term enrichment was performed on the differentially expressed genes for each cluster (log2FC >0.25, p value <.01) and enriched GO terms were defined as terms with more than 10 genes mapping to a term and a p value less than .01 (Fisher's exact test, elim algorithm). Populations that share GO terms are indicated by connecting lines in the dot plot. Individual populations are indicated by a singular dark circle with no intersecting lines. Significant intersections are shown in red and were determined using the SuperExact test. See also Table S5 for a list of the significance of each intersection shown. Samples are colored by cell cluster and arranged in order of increasing to decreasing number of biological processes associated with each population. (c) Heatmap showing the top three GO terms for each microglia and MC cluster. See also Table S4 for a list of all GO processes. Clustering was applied to columns only
