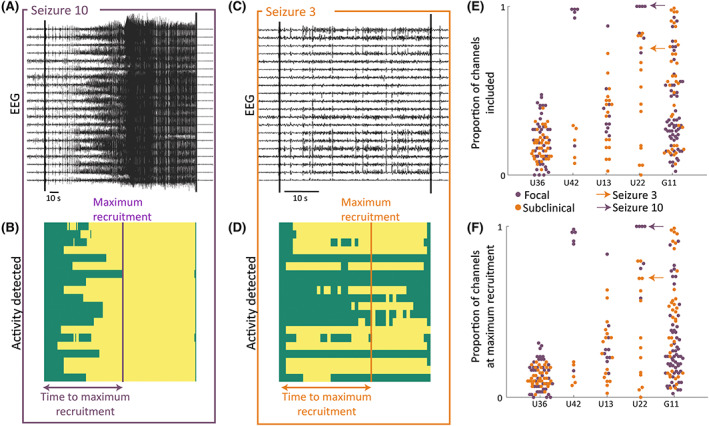
FIGURE 2.

Visualizing spatial markers for example patient U22. (A, C) Intracranial electroencephalographic (EEG) traces of an example focal/subclinical seizure with a subset of recording channels. (B, D) Corresponding binary map of seizure imprint (yellow indicates seizure activity, green no seizure activity) across time in the same subset of channels as in A and C. (E) Swarm plot of the proportion of channels with seizure activity at any point in the seizure for all seizures in five example patients. (F) Swarm plot of the proportion of channels with seizure activity at the point of maximum recruitment for all seizures for five example patients.
