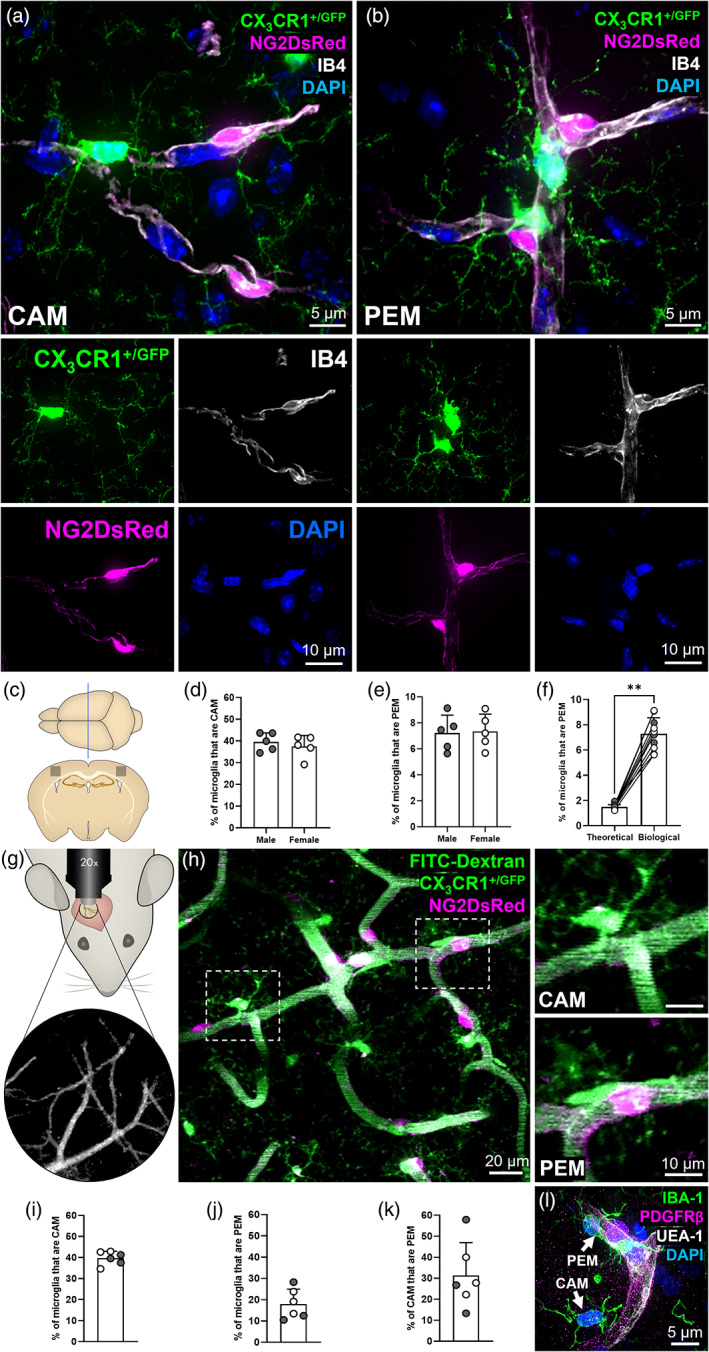
FIGURE 1.

A subset of microglia are directly adjacent to pericytes. (a) Representative example of a capillary‐associated microglia (CAM), in the somatosensory cortex, extending fine processes to contact other DAPI‐positive nuclei. (b) Representative example of two pericyte‐associated microglia (PEM), in the hippocampus, with the bottom PEM morphologically curved around a pericyte. (a, b) For all images: NG2DsRed‐positive pericytes (magenta), CX3CR1+/GFP‐positive microglia (green), IB4‐labeled vessels (white) and DAPI‐labeled nuclei (blue). Each fluorescent channel alone is located below the main image. All images were derived from 12‐week‐old NG2DsRed × CX3CR1+/GFP mice using confocal microscopy. (c) Schematic of region analyzed within the somatosensory cortex of NG2DsRed × CX3CR1+/GFP mice (Bregma −1.5 mm [Allen Reference Atlas, n.d.]). (d, e) Quantification of (d) CAM and (e) PEM in the somatosensory cortex of male (n = 5) and female (n = 5) mice. Data compared with an unpaired parametric t‐test. (f) The predicted percentage of PEM when running simulations with microglia and pericyte densities derived from 10 different biological replicates, compared to the actual PEM percentage from those same 10 somatosensory biological replicates (biological data derived from [e]). Data compared with a Wilcoxon test. Lines represent paired data. (g) Schematic of cranial window location in NG2DsRed × CX3CR1+/GFP mice with blood vessels used as landmarks. (h) Representative 30 μm thick projection image of NG2DsRed‐positive pericytes (magenta), CX3CR1+/GFP‐positive microglia (green) and FITC‐dextran‐positive vessel lumen (green) in layers II/III of the somatosensory cortex of adult NG2DsRed × CX3CR1+/GFP mice imaged using 2PLSM. Dashed boxes highlighting a CAM and PEM are magnified in panels to the right. (i–k) Quantification of the percentage of microglia that are (i) CAM, (j) PEM and (k) the percentage of CAM that are PEM, in layers II/III of the somatosensory cortex of male (n = 3) and female (n = 3) mice. (l) Representative image of PDGFRβ‐positive pericyte (magenta), IBA1‐positive microglia (green), UEA‐1‐labeled vessels (white) and DAPI‐labeled nuclei (blue) from the SFG of a human control brain (93 y.o. female). A CAM and PEM are highlighted by white arrows. For all graphs, gray circles represent males and white circles represent females. Data presented as mean ± SD. **p < .01.
