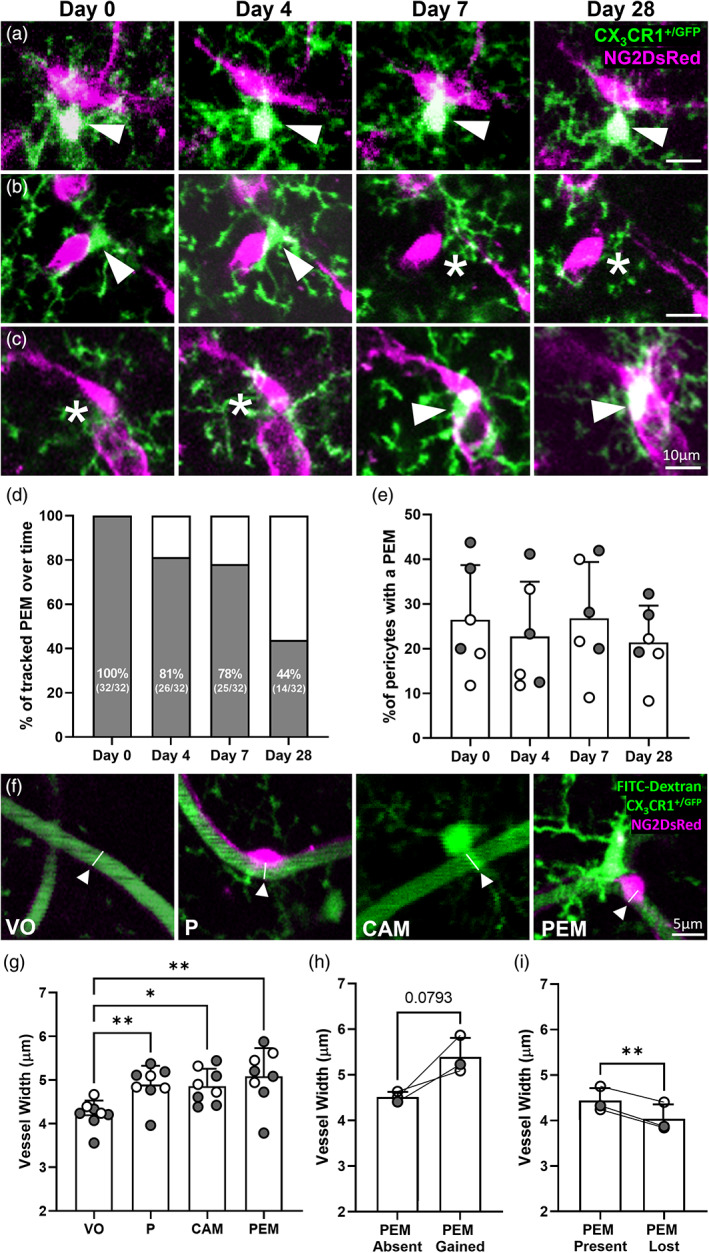
FIGURE 5.

Pericytes can gain or lose PEM over 28 days and vessel width is increased beneath pericyte and microglia soma. (a) Representative in vivo 2PLSM images of a PEM that maintains position for 28 days in the somatosensory cortex of an NG2DsRed × CX3CR1+/GFP mouse. (b) Representative images of a PEM in position for 4 days that is no longer in place on day 7 or 28 of imaging. (c) Representative images of a pericyte with no adjacent PEM on day 0 or 4 but gains a PEM on day 7. (a–c) For all images pericytes are magenta, microglia are green, and images are average intensity projections. White arrowheads highlight a PEM and white asterisks indicate the absence of a PEM. (d, e) Percentage of (d) 32 PEM, identified on day 0 of imaging, that maintain position adjacent to a pericyte on days 4, 7 and 28 of imaging and (e) total pericytes with a PEM per mouse on days 0, 4, 7 and 28 (n = 6, three male and three female). Data in (e) analyzed using a repeated measures one‐way ANOVA (day of imaging F(2.1, 10.4) = 1.8, p = .2137), with Tukey's post hoc test. (f) Representative images indicating locations of vessel width measurement in in vivo 2PLSM images derived from NG2DsRed × CX3CR1+/GFP mice, following administration of the vessel lumen marker FITC‐dextran. White arrowheads indicate the midpoint below the cell soma. (g) Quantification of vessel width (μm) of vessel only (VO), and vessels with a pericyte (P), CAM or a pericyte with a PEM (150, 124, 90 and 124 vessels were measured, respectively, across n = 8 mice, five male and three female). Data presented as average per animal with a minimum of four vessel measurements at VO, P, CAM and PEM per animal. Comparisons were made with a Friedman's test (Friedman statistic = 14.85, p = .0019), with Dunn's post hoc test. (h–i) Quantification of vessel width (μm) of vessels with a pericyte where a PEM was (h) gained or (i) lost (n = 3 mice, 1 male and 2 female). Data presented as average per animal with a minimum of two vessel measurements. Comparisons made with a paired parametric t‐test. For all graphs, gray circles represent males and white circles represent females. Data presented as mean ± SD. *p < .05; **p < .01.
