FIGURE 7.

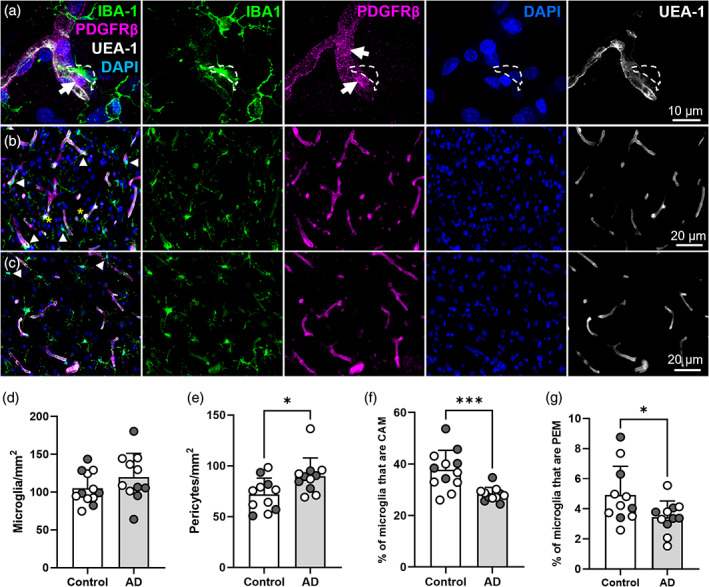
There are more pericytes in the superior frontal gyrus in Alzheimer's disease, but the proportion of microglia that are PEM and CAM is reduced. (a) Representative image of PDGFRβ‐positive pericytes (magenta), IBA1‐positive microglia (green), UEA‐1‐labeled vessels (white) and DAPI‐labeled nuclei (blue) from SFG of a human control brain (93 y.o. female). IBA1, PDGFRβ, DAPI and UEA‐1 channels are shown alone to the right of main image. White arrows identify pericyte soma. White dashed lines outline the position of a PEM. (b, c) Representative images of IBA1, PDGFRβ, DAPI and UEA‐1 combined, and split into individual channels, in the SFG of (b) a control brain and (c) an AD brain. White arrowheads denote CAM and yellow asterisks denote PEM. (d–g) Quantification of (d) microglia, (e) pericytes, (f) CAM and (g) PEM in the SFG of control (n = 11–12) and AD (n = 11) post‐mortem brains. (d, f, g) Analyzed with an unpaired parametric t‐test. (e) Analyzed with an unpaired nonparametric Mann–Whitney test. For all graphs, gray circles represent males and white circles represent females. Data are presented as mean ± SD. *p < .05; **p < .01.
