
FIGURE 2.
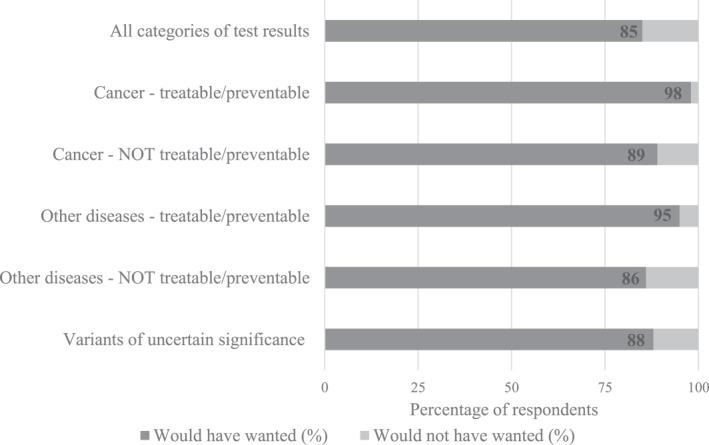
Percentage of respondents reporting their preference (“would have wanted” or “would not have wanted”) for each possible category of test result from genome sequencing. n = 107 parents completed these items at time 1.
Official websites use .gov
A
.gov website belongs to an official
government organization in the United States.
Secure .gov websites use HTTPS
A lock (
) or https:// means you've safely
connected to the .gov website. Share sensitive
information only on official, secure websites.
Percentage of respondents reporting their preference (“would have wanted” or “would not have wanted”) for each possible category of test result from genome sequencing. n = 107 parents completed these items at time 1.