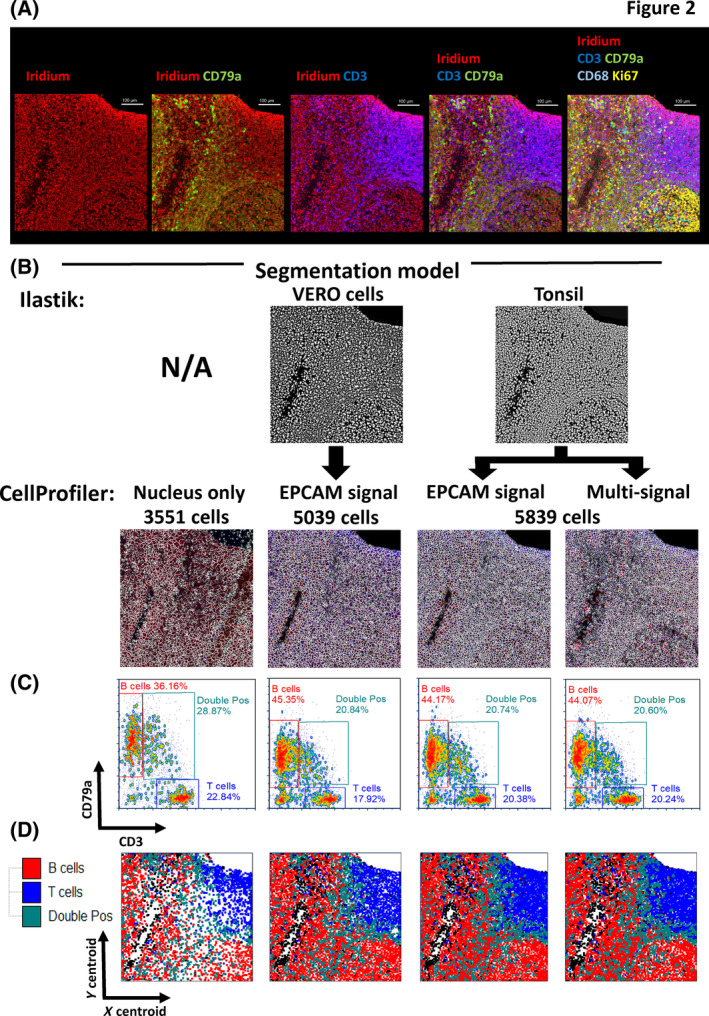
FIGURE 2.

Assessment of segmentation approaches for accurate single‐cell identification in complex tissues using a 28 parameter (27 antibody) imaging mass cytometry (IMC) panel on human FFPE tonsil. (A) Multi‐parameter pseudo‐colored images from a representative human tonsil ROI with well‐separated B‐ and T‐cell areas. The first image column (left to right) shows DNA staining with iridium (red pseudo color), the next column images include CD79a as an overlay (green) with iridium (red), the next shows CD3 (blue) overlaid with iridium (red). The next set of images combine the CD3 (blue), CD79a (green), and iridium (red) as a triple overlay. The final image panel shows the addition of two further parameters, CD68 (teal) and ki67 (yellow). (B) Segmentation maps for the four different segmentation models tested in this study showing the same region of interest (ROI) as in (A). The upper panels show (where used) the probability map outputs from the indicated Ilastik model (derived from either the same tonsil data set or from Vero cells). The lower panels show the segmentation boundaries generated using CellProfiler alone (far left image) or from the indicated Ilastik p‐map. Various approaches to delineate the cell boundary are indicated and include using a single‐membrane signal (EPCAM) or a combination of multiple markers (multisignal). (C) Bivariate single‐cell‐level intensity plots for each of the four segmentation approaches shown in (A) and (B) with CD3 intensity displayed on the x‐axis and CD79a intensity displayed on the y‐axis. In both cases the arcsinh c.f. 1 transformed, Z‐score normalized values have been used. Gates have been set to quantify the percentage of cells that express CD3 or CD79a alone as well as biologically impossible double‐positive (DP) cells that may indicate a failure in accurate segmentation. The total number of single‐cell events is also shown on each plot. (D) x/y cell centroid maps of the same tonsil ROI in (A) to (C) colored by the gated population shown in (C) for each of the four individual segmentation approaches colored as indicated in the legend. [Color figure can be viewed at wileyonlinelibrary.com]
