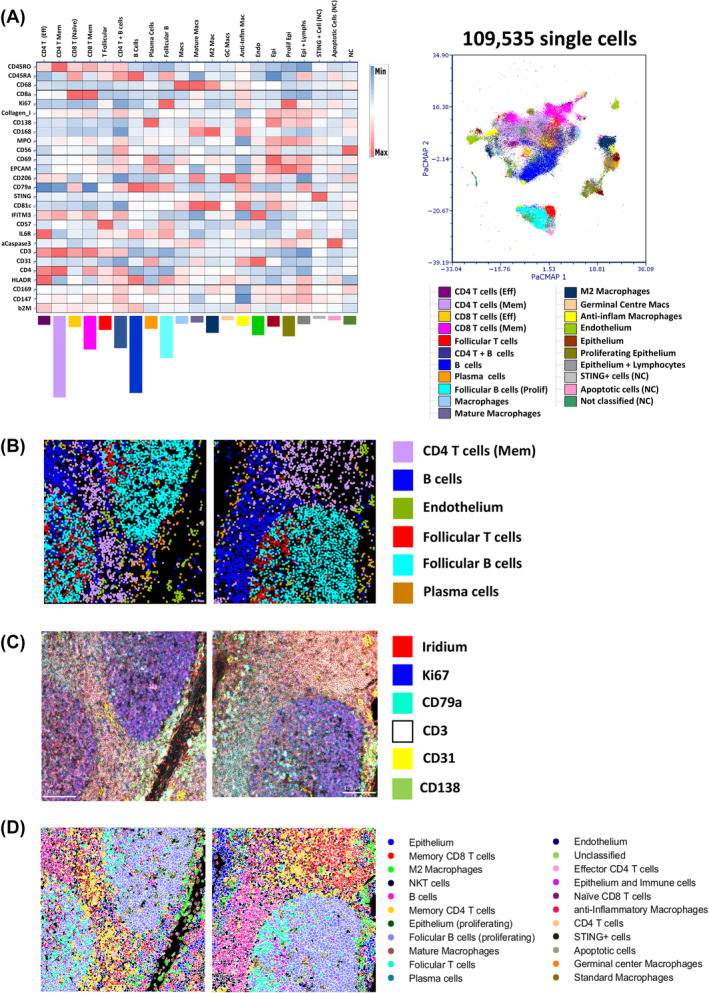
FIGURE 5.

Cell type/state verification using the original imaging mass cytometry (IMC) images and spatial mapping visualization tools. (A) A heat map (left panel) of the 21 final manually merged populations created from the 30 consensus clusters for the “EPCAM” segmentation model shown in Figure 3C. Cluster frequencies are shown by the colored bar charts below each cluster column and the map intensity has been derived from the arcsinh c.f. 1 transformed, Z‐score normalized markers as indicated in each row with further normalization down each column (by cluster). A PacMap dimensionality reduction plot (right panel) of the 109,535 segmented single cells from all 24 tonsil ROIs across the 12 staining batches as shown in Figure 2C but now colored by the final 21 FLOWSOM clusters as per legend. (B) x/y centroid maps for two representative tonsil ROIs with six different unique cell (see legend) clusters displayed. (C) Pseudo‐colored IMC images of the same representative tonsil ROIs as in (B) showing six fiducial stains as indicated in the legend (nuclear plus five antibodies) that support classification of the cell types in (A) and (B). (D) Cluster maps of the same two representative tonsil ROIs as shown in (B) and (C) with all 21 final consensus clusters shown (see legend). [Color figure can be viewed at wileyonlinelibrary.com]
