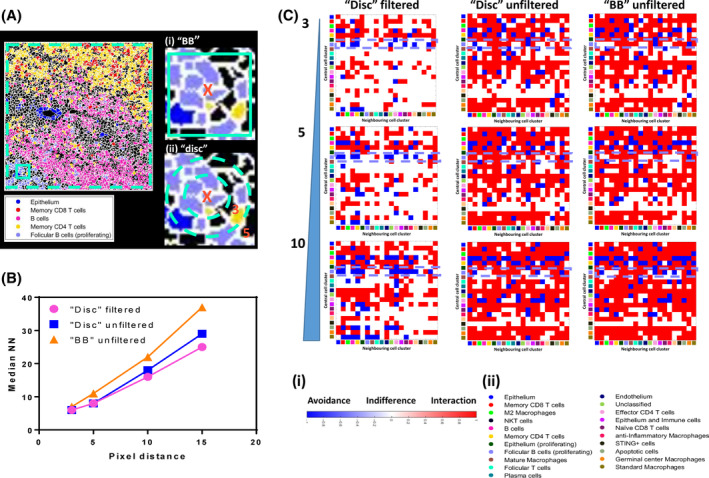
FIGURE 6.

Optimization of spatial “neighborhood” analysis of human tonsil tissue reveals the importance of edge cell removal and the method of pixel expansion. (A) A cluster map for ROI 23 (see Figure S8) only showing 5 of the final consensus clusters (see legend) with clear and expected spatial relationships. The teal dotted line denotes the optional removal of edge cells prior to neighborhood analysis. The area of tissue within the solid teal square has been magnified to show the two methods of pixel expansions for finding neighboring cells to the central cell (X); a “bounding box” (BB) approach (i) or a disc approach (ii). (B) A graph showing the relationship between the selected pixel expansion/distance value (x‐axis) and the median number of nearest neighbors (NN) for each of the three conditions tested (see legend). (C) Interaction heat maps for the different input options shown in B (columns) versus pixel expansion distance (rows, 3, 5, and 10 pixels). The rows for each heat map denote the central cell cluster (marked as X in (A)) and the columns denote the potential neighboring cell types (clusters). The color of each square in the grid relates to the nature of the spatial relationship with red denoting a significant interaction, blue a significant avoidance and white indifference as per legend (i). The clusters in x and y are denoted by color as per legend (ii). The violet dashed boxes highlight the interactions and avoidances of the follicular B‐cell population with the memory CD4 and memory CD8 T‐cell populations. All maps were created using significance cut off of 10% and 100 permutations. [Color figure can be viewed at wileyonlinelibrary.com]
