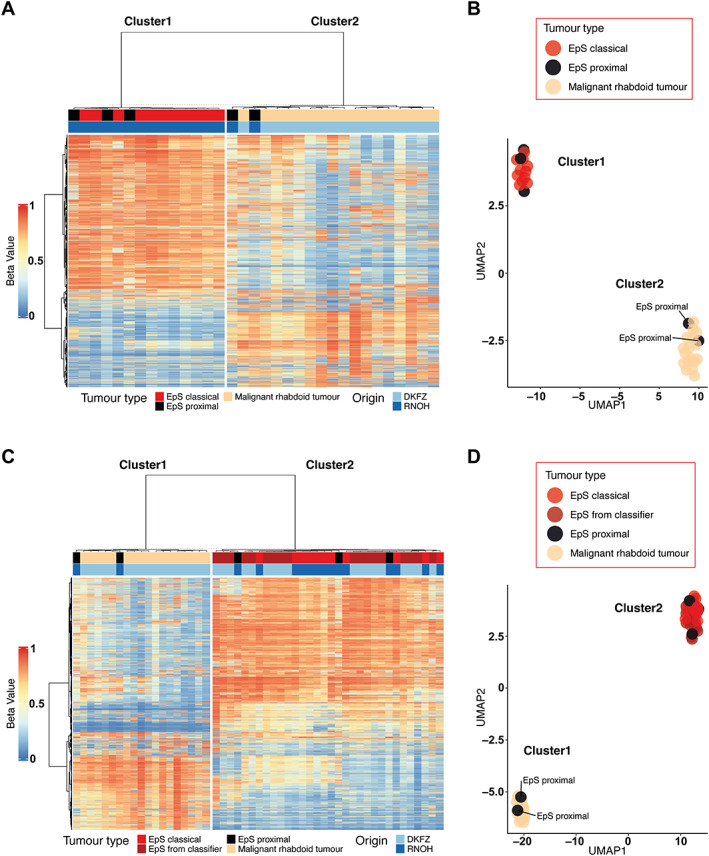
Figure 1.

Hierarchical clustering and dimension reduction in EpS and MRT. (A, B) Heatmap displaying hierarchical clustering and UMAP analysis including EpS (n = 16) and MRT (n = 17) samples. Two EpS samples of the proximal type cluster together with the MRT samples. (C, D) Heatmap displaying hierarchical clustering (C) and UMAP analysis (D) including EpS (n = 16), MRT (n = 17), and additional EpS samples from the DKFZ sarcoma classifier (n = 18). Two EpS samples of the proximal type cluster together with the MRT samples. See the Materials and methods section for details of publicly available data.
