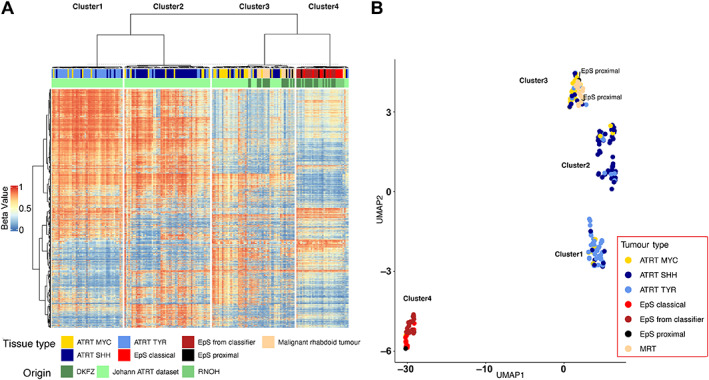
Figure 2.

Hierarchical clustering and dimension reduction of SMARCB1‐deficient neoplasms. (A, B) Heatmap displaying hierarchical clustering and UMAP analysis including EpS (n = 16), EpS from the DKFZ classifier (n = 18), MRT (n = 17), and ATRT (n = 150) samples. Four clusters across SMARCB1‐deficient neoplasms are delineated: cluster1 (ATRT‐TYR), cluster2 (ATRT‐SHH), cluster3 (ATRT‐MYC and MRT), and cluster4 (EpS). Two EpS samples of the proximal type cluster together with the MRT samples. See the Materials and methods section for details of publicly available data.
