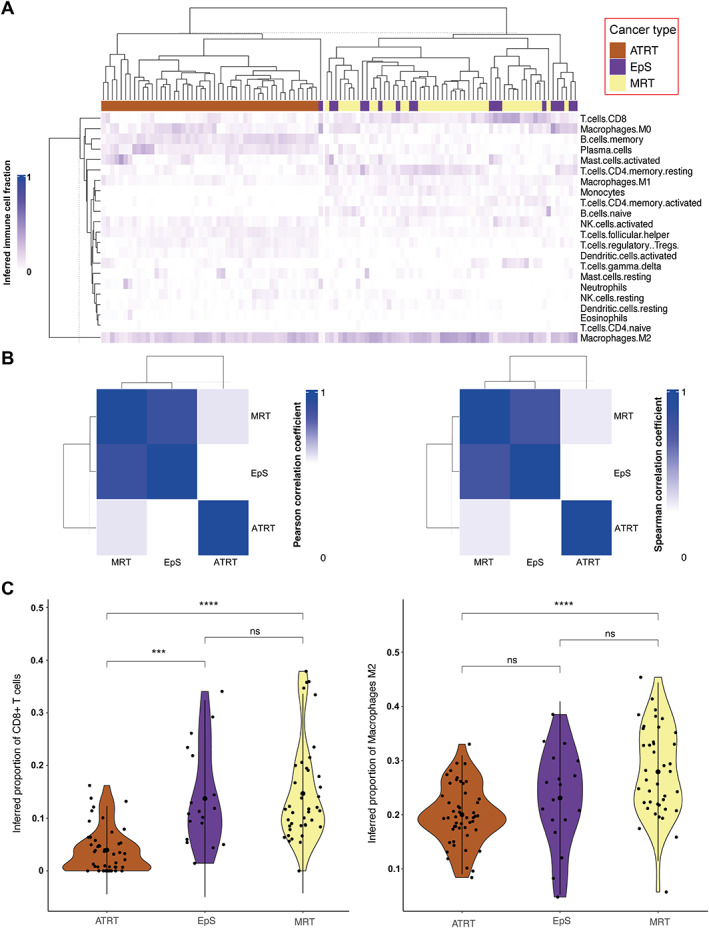
Figure 4.

Summary of in silico immune cell deconvolution in SMARCB1‐deficient neoplasms, EpS, MRT, and ATRT. (A) Heatmap displaying hierarchical cluster based on the percentage of inferred immune cell type per sample for EpS (n = 18), MRT (n = 40), and ATRT (n = 49). (B) Correlation plot (rPear left, rSpear right) based on the mean value of each inferred immune cell type across SMARCB1‐deficient neoplasms. (C) Violin plots showing the inferred fraction of CD8+ T cells (left) and macrophages M2 (right) in EpS, MRT, and ATRT. See the Materials and methods section for details of publicly available data.
