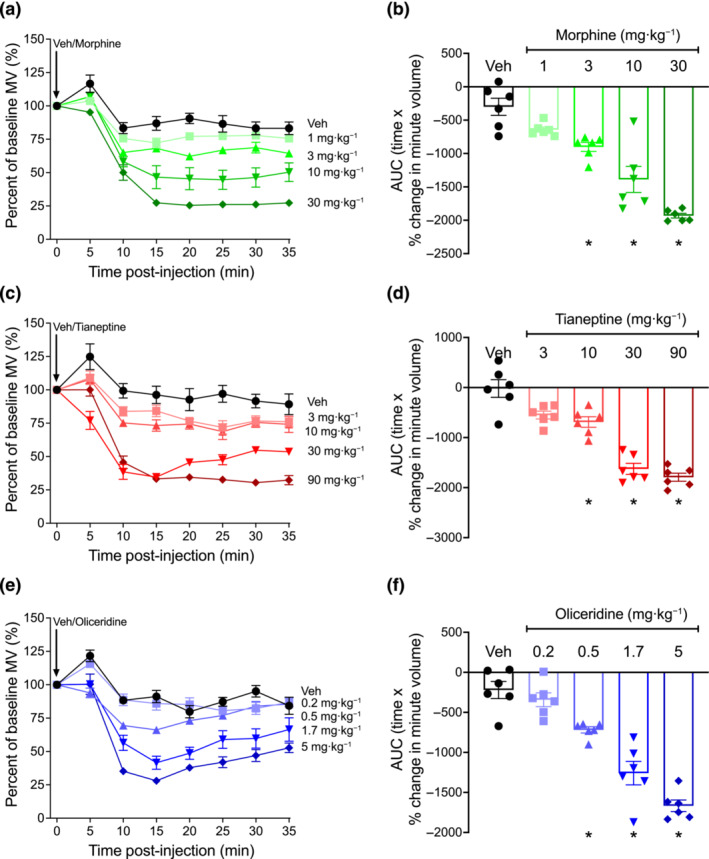
FIGURE 1.

Respiratory depression induced by morphine, tianeptine and oliceridine in mice. (a,b) Morphine (1–30 mg·kg−1 i.p.), (c,d) tianeptine (3–90 mg·kg−1 i.p.) and (e,f) oliceridine (0.2–5 mg·kg−1 i.p.) dose‐dependently depressed mouse respiration. Data shown (a, c, e) are means ±SEM or (b, d, f) individual values with means ±SEM; n = 6 for all groups. Comparison of area under the curve (AUC) values in (b) (F = 2.93; DFn = 4; DFd = 25), (d) (F = 0.74; DFn = 4; DFd = 25) and (f) (F = 1.29; DFn = 4; DFd = 25) were made by one‐way ANOVA, with Tukey's comparison. *P < 0.05, significantly different from vehicle (Veh) control. Statistical test details are provided in Table S2.
