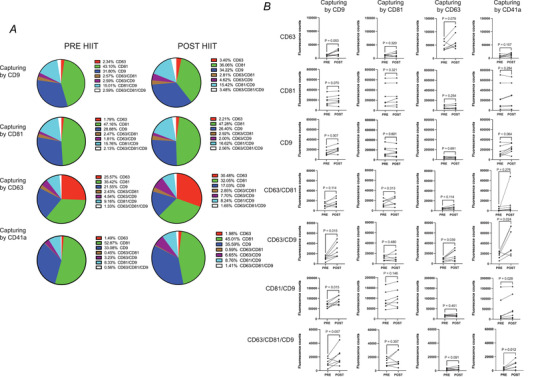
Figure 4. Colocalisation of tetraspanin protein markers in platelet‐free, pre‐ and post‐HIIT plasma.

A, the percentage of sEVs expressing each tetraspanin marker, uniquely and in combination, contributing to the total sEV pool captured on each spot. B, fluorescence counts for CD9, CD63, CD81 and all possible combinations of each on specific CD9, CD63, CD81 and CD41a capture spots. n = 7. P‐values for pre‐ vs. post‐HIIT exercise were determined with Student's paired t test. [Colour figure can be viewed at wileyonlinelibrary.com]
