
FIGURE 3.
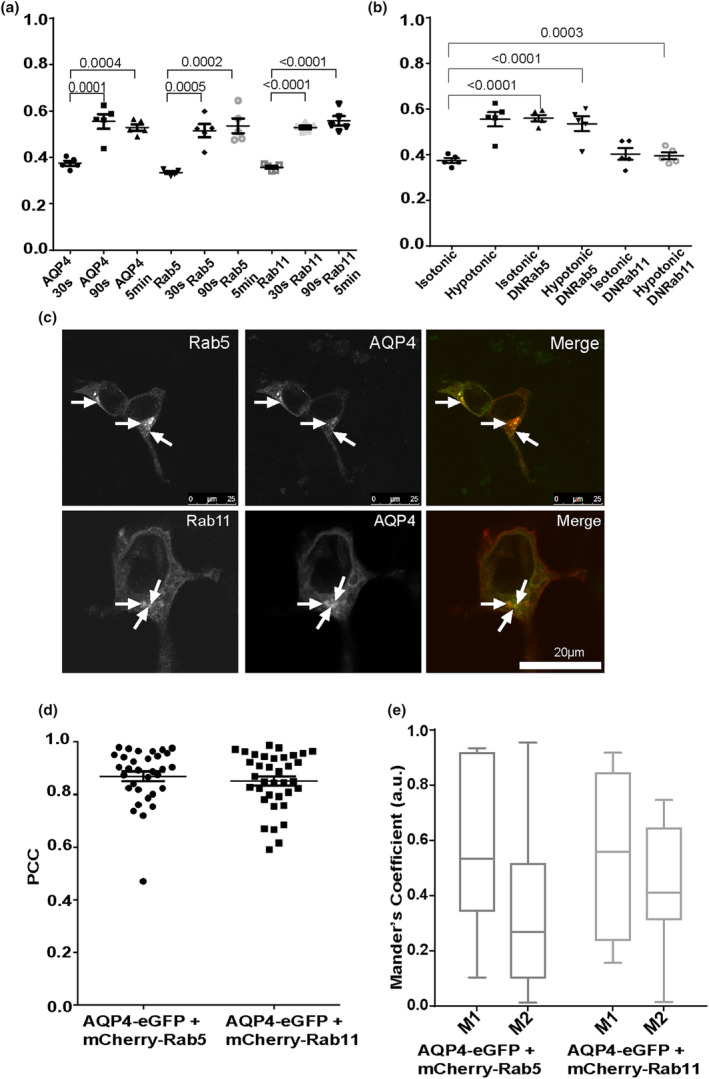
AQP4‐eGFP translocation in HEK293 cells via early and recycling endosomes. HEK293 cells were transfected with AQP4‐eGFP in combination with one of the following: mCherry‐Rab5, mCherry‐Rab11, mCherry‐Rab5DN or DsRed‐Rab11DN. AQP4‐eGFP localisation was imaged by live fluorescence microscopy in an isotonic solution at 30 s, at 5 min following exposure to a hypotonic medium and at 5 min following return back to isotonic medium. Mean RME for AQP4‐eGFP and mCherry‐tagged Rab5 and Rab11 (a), and AQP4eGFP co‐transfected with Rab5DN and Rab11DN (b), averaged over three profiles/cell of at least 10 cells per condition in each repeat in three experimental repeats, n = 3. Cells transiently transfected with AQP4‐eGFP (green), mCherry‐Rab5 or mCherry‐Rab11 (red) and the merged images (yellow) (c). Images of each channel were taken sequentially at 63x magnification. The localisation of AQP4‐eGFP and mCherry‐Rab5 overlaps in many areas (white arrows), as does the localisation of AQP4‐eGFP and mCherry‐Rab11 (white arrows). The scale bar is 25 μm. Correlation (PCC) in selected cells (d) and co‐occurrence (e) in selected cells of AQP4‐eGFP with mCherry‐Rab5 and colocalisation of AQP4‐eGP with mCherry‐Rab11. For each repeat, p values are from a one‐way analysis of variance followed by Bonferroni's correction. All data are presented as mean ± SEM.