Figure 1.

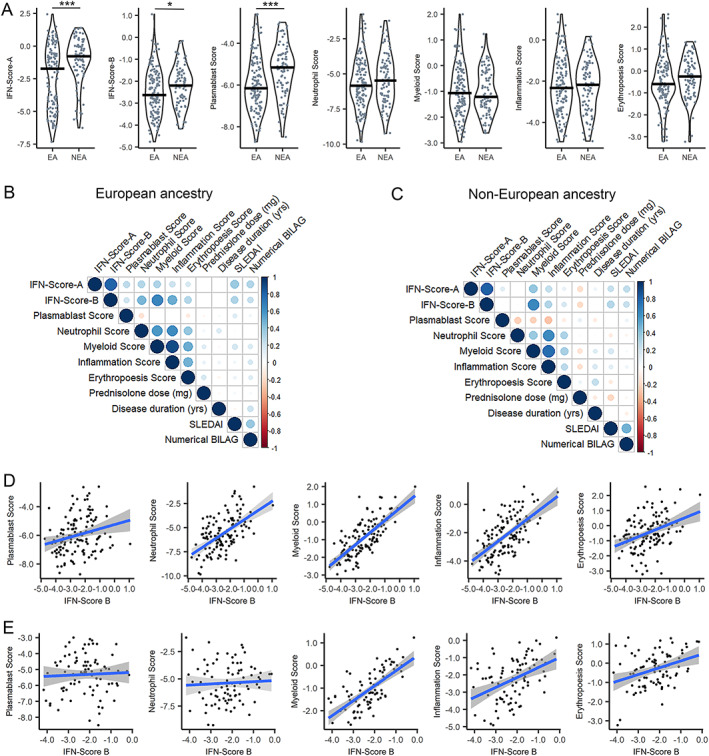
Varied expression levels and interrelationships among annotated gene expression scores by ancestry in patients with systemic lupus erythematosus (SLE). A, Violin plots with overlay jitter points showing distribution of IFN‐Score‐A and IFN‐Score‐B (2 validated continuous expression scores for interferon [IFN]‐stimulated genes) and gene expression scores annotated to plasmablasts, neutrophils, myeloid lineage, and inflammation in SLE patients of European ancestry (EA; n = 128) and non‐European ancestry (NEA; n = 85). Lines inside the plots represent the median. * = P < 0.05; *** = P < 0.001. B and C, Matrix correlograms showing the strength (as indicated by circle size and color intensity) of positive (blue) or negative (red) Spearman's correlation coefficients for associations between annotated gene expression scores and selected clinical variables for SLE patients of European (B) and non‐European (C) ancestry. D and E, Scatterplots showing associations between gene expression scores annotated to plasmablasts, neutrophils, myeloid lineage, inflammation, and erythropoiesis and IFN pathway activation, as measured by IFN‐Score‐B, in patients of European (D) and non‐European (E) ancestry. Lines show regression, and shaded areas show SE. All gene expression scores are shown as ΔCt from reference gene peptidylprolyl isomerase A (PPIA) reflected across zero, such that higher values indicate higher expression levels. SLEDAI = Systemic Lupus Erythematosus Disease Activity Index; BILAG = British Isles Lupus Assessment Group.
