
Figure 4.
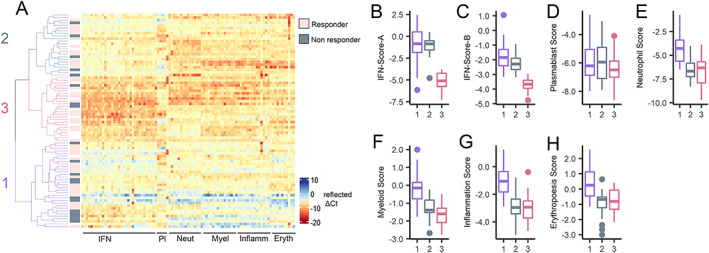
Transcript‐level clustering in SLE patients of European ancestry by disease activity and renal involvement. A, Heatmap showing expression (reflected as ∆Ct) of 94 transcripts organized by module annotation for SLE patients of European ancestry (n = 82) commencing at cycle 1 of rituximab treatment for active SLE within the BILAG Biologics Register. BILAG 2004 responses to rituximab are identified as responder (rose), nonresponder (gray), or undetermined (white). Dendrogram shows by color the 3 clusters identified by transcript‐level unsupervised hierarchical clustering of gene expression. Heatmap is centered and scaled by column (transcript). Pl = platelets; Neut = neutrophils; Myel = myeloid lineage; Inflamm = inflammation; Eryth = erythropoiesis. B–H, Boxplots showing significant differences in gene expression scores annotated to IFN‐Score‐A (B), IFN‐Score‐B (C), plasmablast (D), neutrophil (E), myeloid lineage (F), inflammation (G), and erythropoiesis (H) transcripts according to patient clusters indicated on the dendrogram. Cluster 1 (EA‐1; purple) had high expression across all annotations. Cluster 2 (EA‐2; gray) had high IFN and low neutrophil/myeloid lineage/inflammation/erythropoiesis scores. Cluster 3 (EA‐3; violet red) had low expression across all annotations. Whiskers represent the highest and lowest value, and boxes represents the upper and lower interquartile range. Lines inside the boxes represent the median. Solid circles indicate outliers. See Figure 1 for other definitions.