
Figure 2.
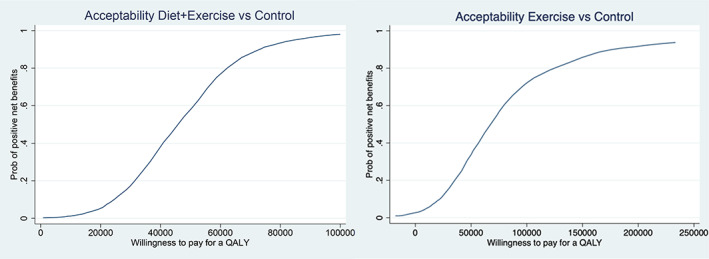
Acceptability curve for programs versus control for net benefits over a range of costs per quality‐adjusted life year (QALY) thresholds. Net monetary benefits for the diet‐plus‐exercise and exercise arms are the difference in QALYs compared to the control group multiplied by the willingness‐to‐pay for a QALY, minus the cost difference between the groups. The acceptability curve shows the probability of the trial sample being consistent with positive net benefits for the diet‐plus‐exercise or the exercise groups as the threshold willingness‐to‐pay for a QALY increases. Prob = probability. Color figure can be viewed in the online issue, which is available at http://onlinelibrary.wiley.com/doi/10.1002/acr.25022/abstract.