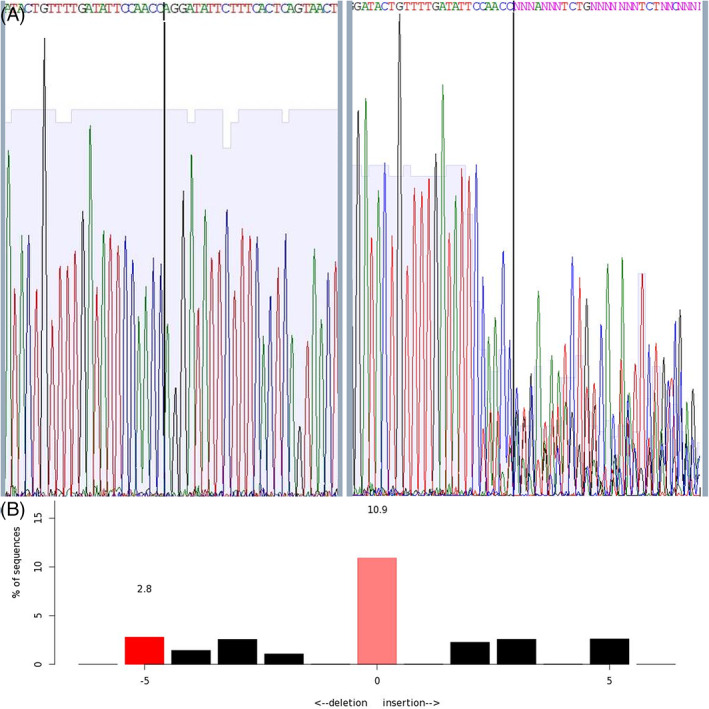
FIGURE 10.

Characterization of INDEL formation using Sanger sequencing and TIDE analysis. Sanger sequencing trace of control (left) and sample 19 (right) ZEG‐extracted DNA. The degradation of the sequence at the expected cut site (black line) results from INDELs caused by the successful CRISPR/Cas‐induced dsDNA break (A). The sequence trace data was input into TIDE to identify the INDELs in the sample (B)
