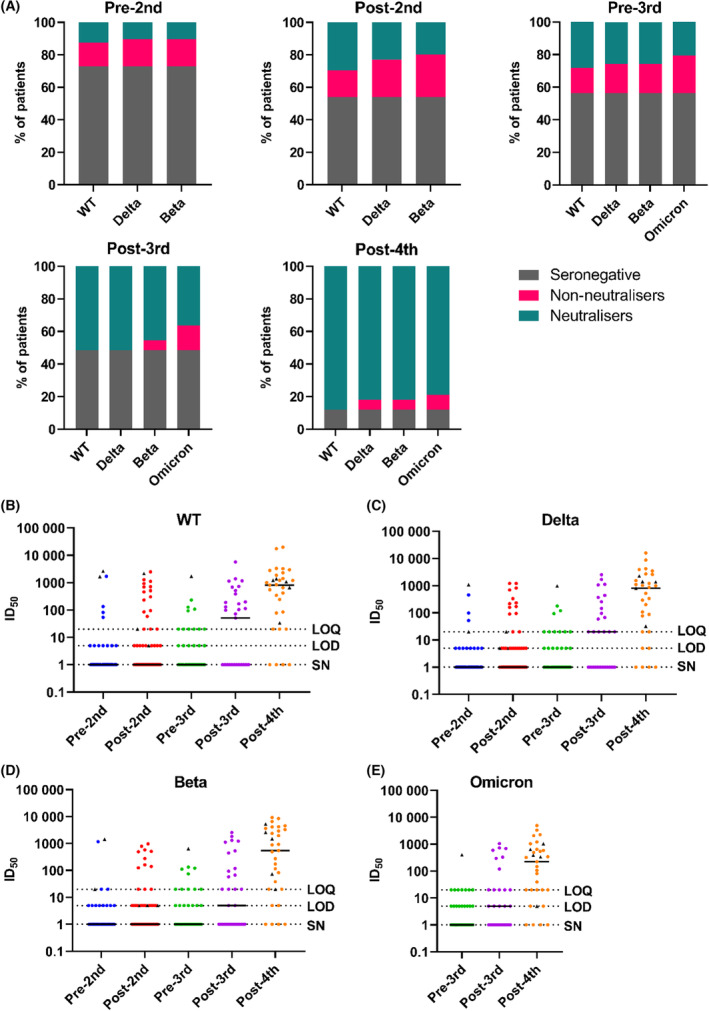
FIGURE 1.

Seroconversion rates and neutralisation titres low after three vaccine doses, but largely rescued by a fourth dose. (A) Percentage of participants at the timepoints indicated above each graph, divided into seronegative, non‐neutralising and neutralising, determined for the wild‐type virus and for the variants indicated. From left to right, data are shown for pre‐second dose (n = 48), 1 month post‐second dose (n = 61), 6 months post‐second dose/pre‐third dose (n = 39), 1 month post‐third dose (n = 33) and 1 month post‐fourth dose (n = 33). Samples with a positive anti‐spike titre but no available sample to test for neutralisation were excluded from this analysis. (B–E) Neutralisation titres for each viral strain, measured over time. Reciprocal ID50 were calculated using data from duplicate serial dilutions where at least two data points exhibited >50% neutralisation. Samples which gave rise to only one data point >50% neutralisation are under the limit of quantification (LOQ) as curve‐fitting cannot be performed and were therefore assigned a value of 1:20 as this is the first dilution in the serial titration. Samples which showed neutralisation <50% at a dilution of 1:20 are below the limit of detection (LOD) and assigned a value of 1:5 to distinguish them graphically from neutralising samples below the LOQ. Seronegative (SN) samples were assigned a value of 1 for the purposes of the logarithmic scale. Patients with either a detectable anti‐N titre prior to the start of the study or with a recorded SARS‐CoV‐2 infection are indicated at all subsequent timepoints with black triangles
