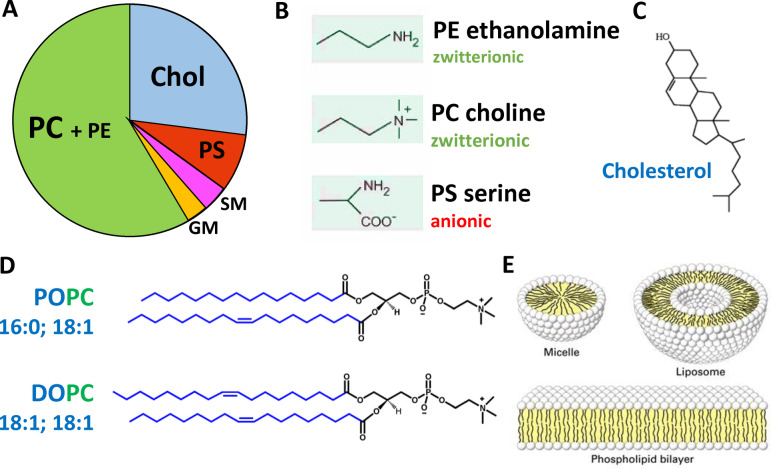
Figure 2.
Composition and structures of the lipid bilayer. (A) Chart showing approximated proportions of key lipid components of neuronal membranes by weight. [62] PC=Phosphatidylcholine; PE=phosphatidylethanolamine; PS=phosphatidylserine; GM=ganglioside; SM=sphingomyelin. (B) Some key phospholipid headgroups. (C) Cholesterol structure. (D) Two of many acyl chain combinations, 16:0–18 : 1 PS (POPS) 1‐palmitoyl‐2‐oleoyl‐sn‐glycero‐3‐phospho‐L‐serine; 18 : 1–18 : 1 (DOPC) 1,2‐Dioleoyl‐sn‐glycero‐3‐phosphocholine. (E) Cartoon of membrane structures.

