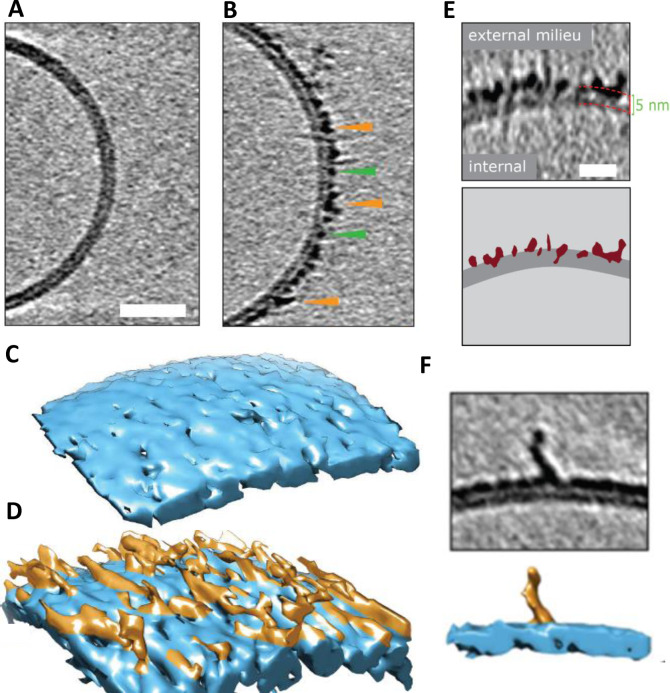
Figure 3.
Cryo‐electron tomographic images of Aβ42 curvilinear protofibrils and oligomers on lipid vesicles. (A) Large unilamellar vesicle with Aβ42 monomer, indistinguishable from vesicles with no Aβ. (B) Lag‐phase Aβ42 oligomers/protofibrils decorate the outer surface of the bilayer. Tomographic slices are 7.6 nm thick, green and orange arrowheads highlight oligomers and curvilinear protofibrils, respectively. Scale bar: 25 nm. (C–D) 3D single threshold rendered surface, image shows lipid bilayer, 5 nm thick (blue) in the absence and presence of Aβ oligomers/protofibrils carpeting the membrane. (E) The heightened density indicates Aβ oligomer are also inserted within the membrane, Aβ protofibrils and oligomers (burgundy) inserting into the lipid bilayer (dark grey), scale bar: 10 nm. (F) 3D single threshold rendered surface; image shows curvilinear protofibrils orthogonal to membrane. Adapted from [23].

