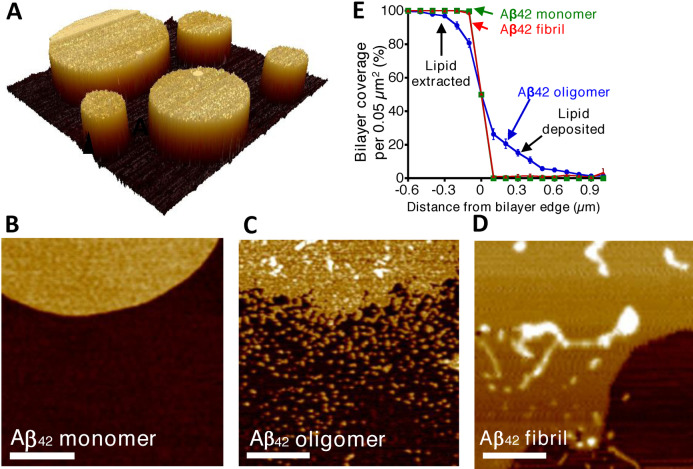
Figure 5.
AFM imaging indicates Aβ42 oligomers have a detergent‐like effect on the supported lipid bilayer, which is not seen for Aβ42 monomer or fibrils. (A) AFM topographical image of lipid bilayer supported on mica surface. (B) AFM images are shown for mica‐supported lipid bilayers on exposure to Aβ42 monomer. (C) Aβ42 oligomers. (D) Aβ42 fibrils. Scale bar 500 nm, height scale range 12 nm. (E) Percentage of bilayer coverage at the edge of a lipid bilayer, exposed to Aβ42 monomer (green), oligomer (blue), and fibril (red). Each data point represents an average percentage of bilayer coverage within a 0.1×0.5‐μm region. There were 20 measurements per data point, measured across three separate mica‐supported lipid bilayer preparations. Error bars, S.E. Adapted from [25].

