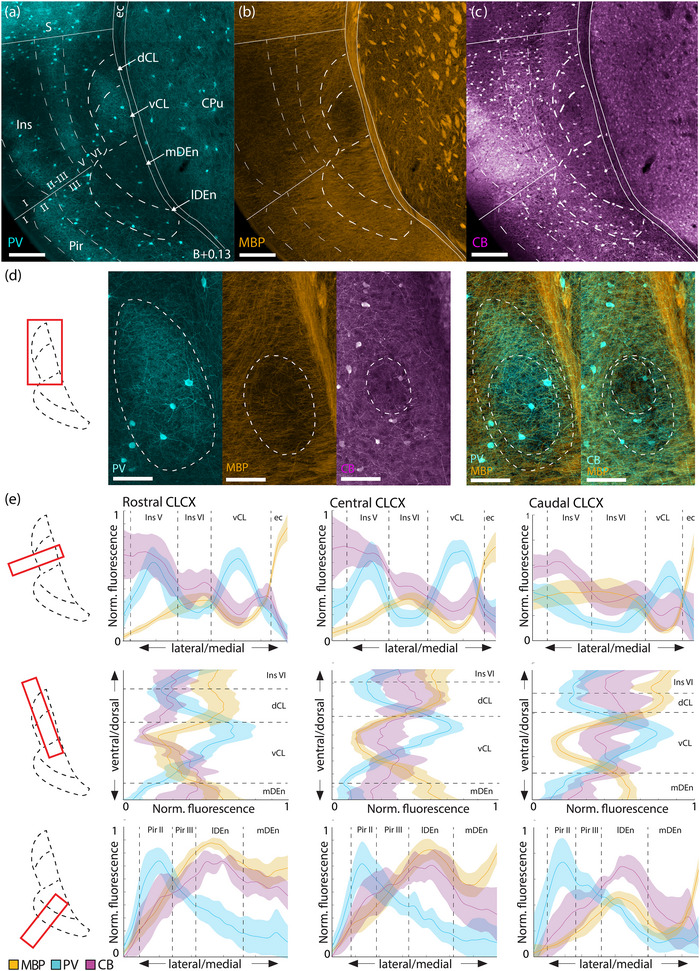
FIGURE 1.

Fiber‐architectural characterization of the claustrum complex. (a–c) Reappraisal of borders to claustrum complex (CLCX) based on overlapping patterns in tissue triple‐stained for parvalbumin (PV), myelin basic protein (MBP), and calbindin (CB) in female C57 mouse. Scale bars measure 200 μm. (d) Delineations of the PV‐plexus, MBP‐gap, and CB‐gap in the same tissue. The two rightmost panels show merged expression of MBP/PV and MBP/CB expression. Both PV and CB labelings are pseudo‐colored cyan to increase visibility. Scale bars measure 100 μm. (e) Average fluorescence traces of PV (n = 5 mice) MBP (n = 5 mice), and CB (n = 3 mice) along mediolateral and dorsoventral gradients, at rostral (B+0.97), central (B+0.13), and caudal (B−0.59) levels of the CLCX. Bilateral measurements were made in each brain. Dashed lines indicate approximate borders based on the combined profile patterns. Fluorescence measures were normalized across images using min–max scaling. Shaded areas indicate 95% confidence intervals. Images at each rostrocaudal level were warped to a reference section. Abbreviated terms are explained in the list of abbreviations. Confocal images in (a–d) show maximum intensity projections of z‐stacks taken at 10× magnification.
