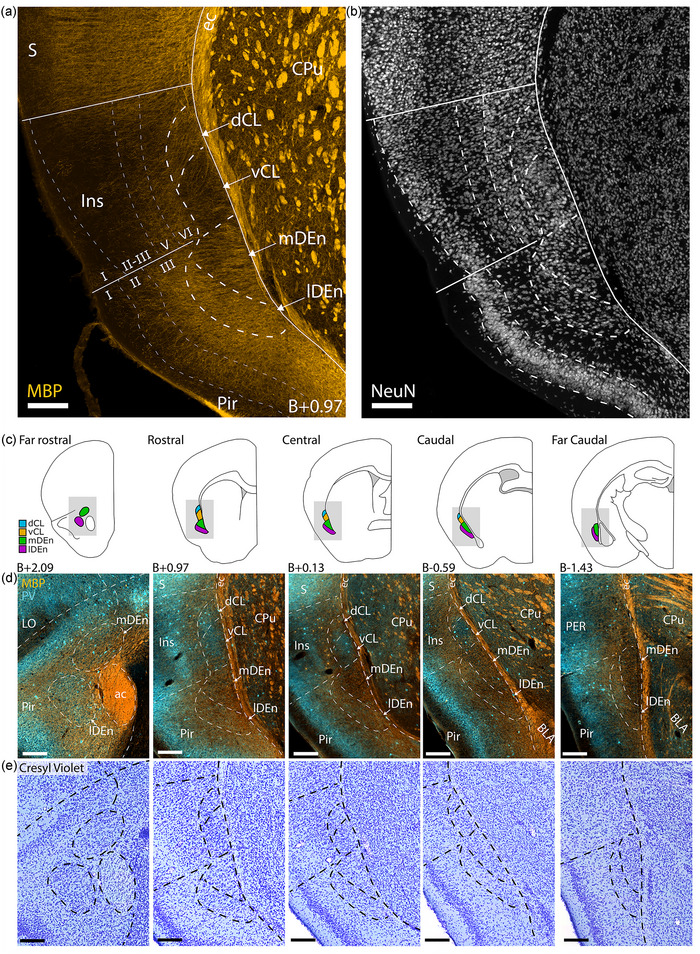
FIGURE 3.

Comparison of fiber‐ and cytoarchitecture of the claustrum complex (CLCX). (a and b) Immunohistochemical staining against myelin basic protein (MBP) and NeuN in male C57 mouse. Delineations based on fiber‐architectural patterns overlap with those seen in cytoarchitecture. (c) Schematic representation of the CLCX at five rostrocaudal landmarks. Shaded areas indicate inset location in (d and e). Approximate location to bregma is shown at each landmark. (d) Co‐expression of MBP and parvalbumin (PV) at each landmark. (e) Cresyl Violet staining of the same sections shown in (d). Scale bars measure 200 μm. Abbreviated terms are explained in the list of abbreviations. Panels a and b show maximum intensity projections of z‐stacks taken with a confocal microscope at ×10 magnification, whereas panels d and e show images taken with a slide scanner of a female C57 mouse.
