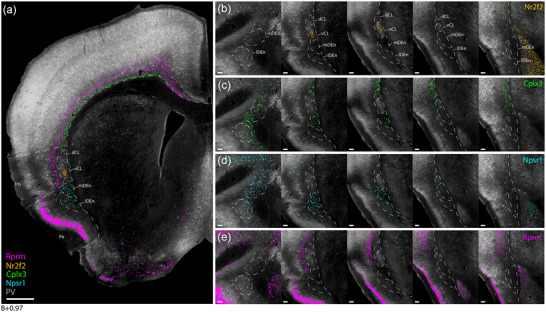
FIGURE 4.

Genetic marker expression in the claustrum complex. Gene expression images were collected from the Allen hybridization (ISH) database and aligned to a reference section from a female C57 mouse (see Section 2 for details). (a) Combined expression of Nr2f2, Cplx3, Npsr1, and Rprm genes superimposed onto a reference section located at the rostral landmark. (b–e) Individual gene expression in the claustrum region from the five levels taken at the previously defined landmarks (see Figure 3), showing higher subregional specificity than more general markers like Gnb4 and Ntng2 (see Figure S2). Scale bars measure 500 μm in (a), and 100 μm in (b–e).
