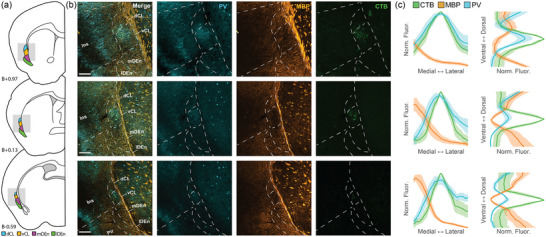
FIGURE 5.

Retrosplenial cortex (RSC)‐projecting claustrum neurons overlap with the parvalbumin (PV) peak and the myelin basic protein (MBP) trough in the CL of a male C57 mouse. (a) Schematic representation of tissue sections used for immunohistochemical (IHC) and further analysis. (b) Representative images of the claustrum complex (CLCX) from sections depicted in (a) with retrogradely labeled claustrum neurons (green) and immunostaining against MBP (orange) and PV (cyan). Scale bars represent 200 μm. Images show maximum intensity projection of confocal images. (c) Normalized fluorescence traces for each of the sections in (b) along the mediolateral (left) and dorsoventral (right) axes. Shaded areas represent 95% confidence intervals.
