FIGURE 6.

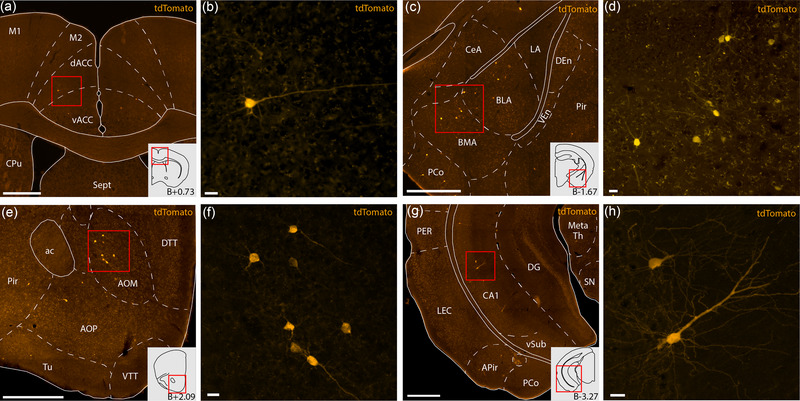
Example sections from rabies tracing dataset showcasing monosynaptic input cells projecting to the claustrum complex (CLCX) from anterior cingulate cortex (ACC; a and b), basolateral amygdala (BLA; c and d), medial anterior olfactory area (AOM; e and f), and cornu ammonis 1 (CA1; g and h). All delineations are based on Cresyl Violet staining of the same tissue. Input cells are labeled by a tdTomato‐tag expressed by the rabies virus. Schematics in the bottom right corner of panels a, d, e, and g show outlines of each representative coronal section, and the approximate distance relative to bregma. Scale bars measure 500 μm in panels a, c, e, g and 20 μm in panels b, d, f and h. Abbreviated terms are explained in the list of abbreviations. Images were taken with a slide scanner and shows sections from two female animals Rb11 (a and b) and Rb2 (c and d), and two male animals Rb10 (e and f) and Rb12 (g and h).
