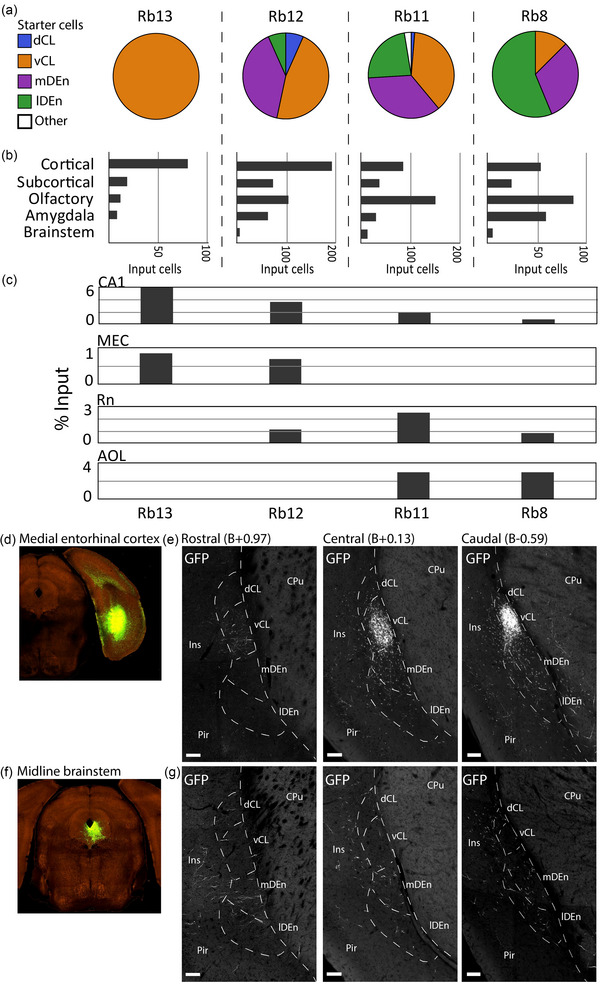
FIGURE 9.

Comparison of input and starter cell populations. (a) Starter cell distributions in four representative brains displaying various proportions of starter cells in the claustrum complex (CLCX). (b) Coarse input distributions in the same four brains. (c) Percentage of inputs from cornu ammonis 1 (CA1), medial entorhinal cortex (MEC), raphe nuclei (Rn), and lateral anterior olfactory nucleus (AOL), in representative brains. (d) Injection site for experiment 518745840 with an injection of rAAV‐EGFP anterograde tracer in the MEC (2017 Allen Institute for Brain Science, Projection Dataset, Available from: https://connectivity.brain‐map.org/). (e) Axonal projections from MEC innervating rostral, central, and caudal parts of the claustrum complex. Images were warped onto matching reference‐sections to align the signal with fiber‐ and cytoarchitectural delineations. (f) The same as d, but from experiment 272699357 with the same anterograde tracer deposited in midline brainstem areas Rn and periaqueductal gray. (g) The same as in e, but from experiment 272699357. Scale bars measure 100 μm. Image credit (d–g): Allen Institute.
