Figure 2.

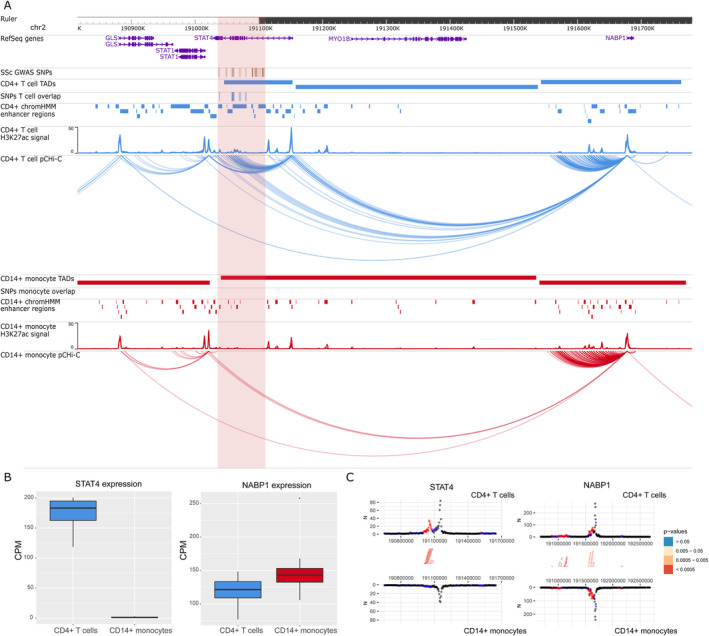
Promoter capture Hi‐C (pCHi‐C) interactions and gene expression in the rs11117420 (STAT4) GWAS locus. A, Genomic coordinates (GRCh38) are shown at the top of the panel. The tracks include NCBI RefSeq genes, SSc‐associated GWAS SNPs from López‐Isac et al (ref. 9) and those in high LD (r2 > 0.8), TADs (shown as bars), SNPs overlapping promoter interacting regions and enhancer regions, enhancer regions as defined by ChromHMM, H3K27ac signal, and pCHi‐C significant interactions (CHiCAGO score >5) (shown as arcs) in CD4+ T cells (blue) and CD14+ monocytes (red). The red highlighted region includes the block of all the SSc‐associated SNPs in LD. B, Box plots of STAT4 (left) and NABP1 (right) expression levels in CD4+ T cells and CD14+ monocytes in count per million (CPM). Each box represents the 25th to 75th percentiles. Lines inside the boxes represent the median. Lines outside the boxes represent the 10th and 90th percentiles. The dot represents an outlier. C, Chicdiff bait profiles for STAT4 (left) and NABP1 (right). Plots show the raw read counts versus linear distance from the bait fragment as mirror images for CD4+ T cells (top) and CD14+ monocytes (bottom). Other‐end interacting fragments are pooled and color‐coded by their weighted adjusted P value. Significant differentially interacting regions detected by Chicdiff overlapping SSc‐associated GWAS SNPs and enhancer regions are depicted as red blocks. See Figure 1 for other definitions.
