FIGURE 1.

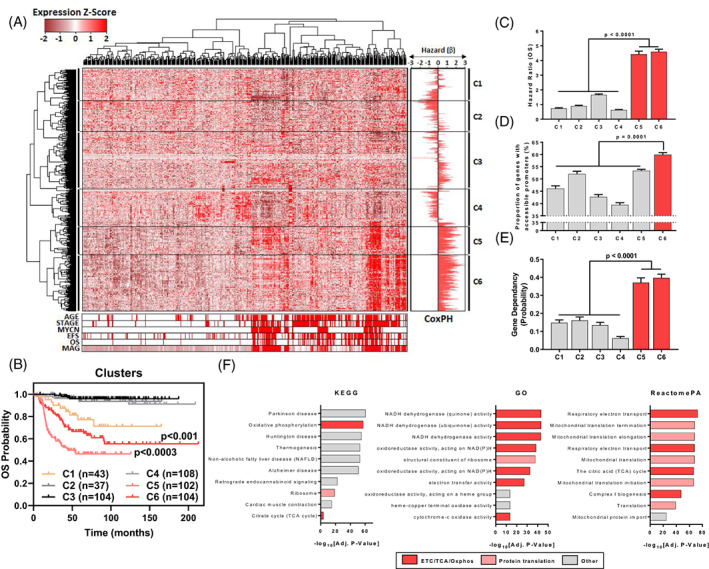
A subset of mitochondria‐associated genes associates with NB cell survival, high chromatin accessibility and poor patient survival. (A) 1148 Mitochondrial Associated Genes (MAGs) were derived from the integration of 28 mitochondrial gene sets from the MSigDB. Hierarchical clustering of gene expression (1148 MAGs) in the SEQC NB Cohort (RNA‐Seq; GSE62564) are represented as a heatmap with clinical annotations (Age [<18 Months vs >18 Months], Stage [1,2,3,4 s vs 4], MYCN Status [Non‐Amp vs Amp], EFS Event, OS Event & MAG scores for each patient). β‐coefficients from univariate Cox Proportional Hazards (CoxPH) models, using the median expression of each MAG (n = 1148) as a cut‐off, are shown as a bidirectional bar graph. (B) Patients from the SEQC NB cohort (n = 498) were subdivided based on cluster expression (RNA‐Seq) and their overall survival probability was plotted on a Kaplan‐Meier curve. Comparisons are made between C5 vs C1,2,3,4,6 and C6 vs C1,23,4. (C) Mean hazard ratios (HR = e[β]) of each cluster are shown with the error bars representing the SEM of HR's within a cluster. (D) The proportion of genes with accessible promoters in each cluster with error bars representing the SEM across all 7 NB cell lines (where an accessible promoter had significant enrichment of ATAC signal, FDR q‐value <0.05, −1000/+100 bp from TSS). (E) The mean gene dependency probability scores for each gene cluster derived from Project Achilles. Error bars represent the SE of the mean in each MAG cluster. (F) Gene set enrichment of C6 genes using KEGG, GO and ReactomePA databases, the top 10 genesets enriched for C6 genes are shown, with gensets being ranked by ‐log10[Adjusted P value]. Each gene set is also categorised by broad process involvement (ETC, electron transport chain; TCA, tricarboxylic acid cycle, Oxphos, oxidative phosphorylation). Error bars represent the SE of the mean in each MAG cluster
