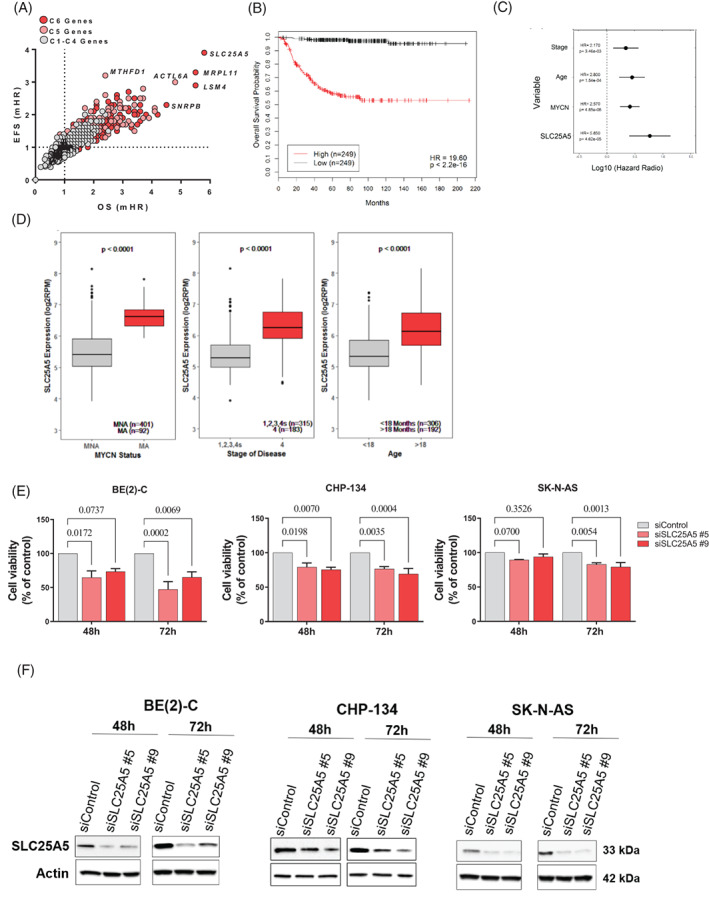
FIGURE 2.

High SLC25A5 gene expression is predictive of poor NB patient prognosis. (A) The median gene expression (RNA‐Seq) of each MAG (n = 1148) was considered as a prognostic variable alongside classical predictors of NB patient outcome (MYCN Amplification Status [amplified vs non‐amplified], Stage of Disease [Stage 1,2,3,4 s vs Stage 4] & Age [>18 months vs < 18 months]) in iterative multivariate CoxPH models using the SEQC NB patient cohort (n = 498). The dot plot represents the multivariate hazards ratios from the CoxPH models for each gene with regard to event free survival (EFS)/overall survival (OS) probability of patients and cluster identity. (B) Kaplan‐Meier survival curves showing the OS probability of patients in the SEQC NB cohort (n = 498) when dichotomised by median SLC25A5 gene expression (RNA‐Seq). Hazard Ratio's (HR) and log‐rank P values are presented from a univariate CoxPH model. (C) Summary of the OS multivariate CoxPH models with SLC25A5 gene expression against classical prognostic predictors, dots represent the median HR whilst lines represent the 95% confidence interval. (D) Box plots of SLC25A5 gene expression subdivided using established prognostic predictors of poor NB patient outcome in the SEQC cohort (n = 498), patients are stratified by either; MYCN amplification status (MYCN non‐amplified; MNA, MYCN amplified; MA), stage of disease according to the International Neuroblastoma Staging System (INSS) (Stage 1,2,3,4 s vs 4) and age at diagnosis (<18 vs >18 months of age). (E) Cell viability of BE(2)‐C, CHP‐134 and SK‐N‐AS cell lines following siRNA mediated knockdown of SLC25A5 for 48‐72 h. SLC25A5 siRNA (#5 & #9) are compared with the non‐targeted siControl using a two‐way ANOVA with multiple comparison, reported P values are adjusted for multiple comparisons. (F) Representative western blot of SK‐N‐BE(2)‐C, CHP‐134 and SK‐N‐AS cells transfected with control or SLC25A5 siRNA for 72 h to confirm sufficient knockdown of SLC25A5 for cell viability assays
