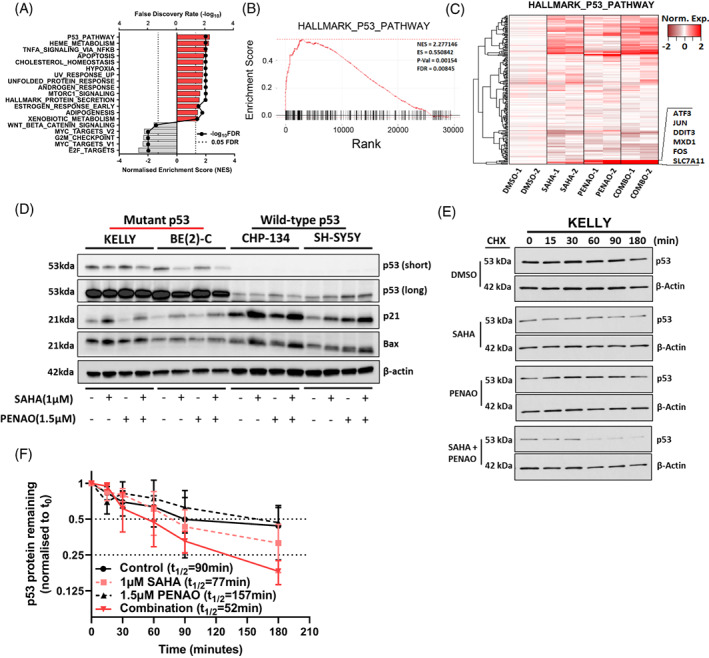
FIGURE 5.

SAHA combined with PENAO synergistically reduces mutant p53 protein stability. (A) The TP53 wild type cell line SH‐SY5Y was subject to either vehicle control, SAHA (1 μM), PENAO (1.5 μM) or combination treatments for 8 h, followed by mRNA microarray analysis. Differentially expressed genes between conditions were determined and ranked for a Gene Set Enrichment Analysis (GSEA) using the MSigDb hallmark database. Significant pathways (FDR < 0.05) are displayed along with their normalised enrichment score (NES). (B) Enrichment plot displaying the relative enrichment and rank of differentially expressed genes present in the HALLMARK_P53_PATHWAY gene set (indicated by black lines on the x‐axis). Statistics from the GSEA are reported inside the plot. (C) Heatmap of gene expression among treatment conditions in genes within the HALLMARK_P53_PATHWAY gene set, highly expressed genes in the combination which are clustered tightly are highlighted and annotated on the side. (D) Immunoblot of NB cell lysates after 24 h of the indicated treatments, probed with either; anti‐p53, anti‐p21, anti‐Bax or anti‐β‐Actin antibodies. Approximate band sizes are shown to the left of the blots, cell lines used are indicated the top, treatments are indicated below. Both a short and long exposure of anti‐p53 probed membrane are provided. (E) Immunoblot of cycloheximide chases spanning 3 h in KELLY cells treated with DMSO, SAHA 1 μM, PENAO 1.5 μM or the combination for 24 h, probed with anti‐p53 and anti‐β‐Actin. (F) Densitometry of the cycloheximide chase immunoblots are provided, p53 levels are normalised to loading controls and then to the 0‐min time point, error bars represent the stand error of the mean from three independent experiments. The half‐life (t 1/2) of p53 in each condition is reported in the legend
