Figure 6.

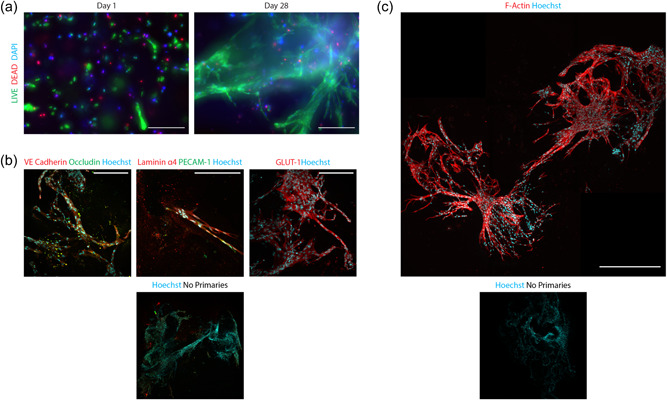
Immunofluorescence images of 3D bioprinted iBMECLs on day 28. (a) Maximum intensity projections of iBMECLs at days 1 and 28, stained with calcein AM (live) and EthD (dead). Images were taken using a 10× objective. Scale bar = 200 μm. (b) Maximum intensity projections of the expression of VE cadherin, occludin, laminin α4, PECAM‐1, and GLUT‐1 by iBMECLs. Images were taken using a 25× water objective. Scale bar = 200 μm. (c) Maximum intensity projection of F‐actin staining of iBMECLs shows the development of a complex network throughout the matrix. Image taken using a 40× dry objective. Scale bar = 500 μm. AM, Astrocyte Medium; EthD, ethidium homodimer; GLUT‐1, glucose transporter‐1; iBMECLs, iPSC‐derived BMEC‐like cells; iPSC, induced pluripotent stem cell; PECAM‐1, platelet endothelial cell adhesion molecule‐1; VE, vascular endothelial.
