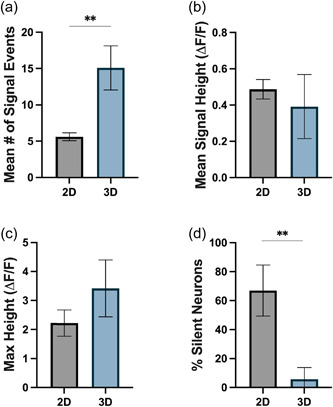
Figure 8.

Quantification of spontaneous live‐cell calcium imaging of iPSC‐derived neurons cultured in 2D and bioprinted 3D cultures after 4 weeks of differentiation. The figure shows the quantification of (a) mean number of spontaneous calcium transients per active neuron, (b) mean signal height of each spontaneous calcium transient as measured by the change in fluorescence (ΔF/F), (c) mean maximum height of calcium transients in each neuron as measured by ΔF/F, and (d) proportion of neurons which showed no spontaneous calcium transients (termed silent neurons) over the recording period (10 min). An unpaired t test was used to determine significant differences between conditions. **p < 0.01. iPSC, induced pluripotent stem cell.
