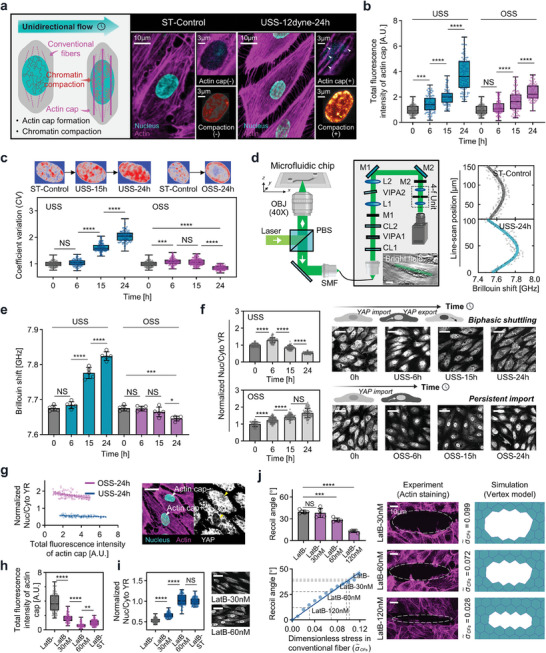
Figure 1.

The connection between actin cap formation, nuclear mechanics alteration, and YAP localization under flow shear stress. a) Schematic of endothelial cell subjected to unidirectional flow with increasing actin cap formation and chromatin compaction. Arrowhead indicates the actin cap and chromatin compaction. b,c) Total fluorescence intensity of actin cap and coefficient of variation (CV) in response to unidirectional shear stress (USS, 12 dyne cm−2) and oscillatory shear stress (OSS, 0±12 dyne cm−2, 1 Hz) (3 independent experiments, n > 80 cells, normalized to mean of control). d) Brillouin microscopy combined with the microfluidic chip (Scale bars, 20 µm). e) Time‐dependent increase in Brillouin shift in response to USS and OSS (n = 5 for each condition). f) Cells subjected to USS with YAP showing initial nuclear localization followed by cytoplasmic retention, and cells subjected to OSS with continuous YAP nuclear localization (IMARIS easy 3D projection, Scale bars, 40 µm). Quantification of YAP nuclear‐cytoplasmic ratio (YR) in response to USS and OSS (3 independent experiments, n > 80 cells, normalized to mean of control). g) Linear regression of normalized YR and total fluorescence intensity of actin cap under 24 h USS and OSS (p < 0.01). The schematic diagram illustrates that cells with actin cap exhibit a lower YR (Scale bars, 20 µm). h,i) Total fluorescence intensity of actin cap and normalized YR of LatB‐untreated, 30, and 60 nM under 24 h USS (12 dyne cm−2), and the static control (3 independent experiments, n > 80 cells. Scale bars, 20 µm). j) Experimental recoil angle results following laser ablation under various doses of LatB (top left, n = 5 for each condition); Vertex simulation shows a positive correlation between recoil angle and dimensionless stress within conventional fibers (bottom left, dash lines indicate the experimental measured recoil angle and the corresponding stress); Schematic of laser ablation experiment with 30, 60, and 120 nM LatB, and the corresponding vertex simulation (right panel). All data are shown as mean ± s.d. *p<0.05; **p<0.01; ***p<0.001; ****p<0.0001; NS, not significant.
