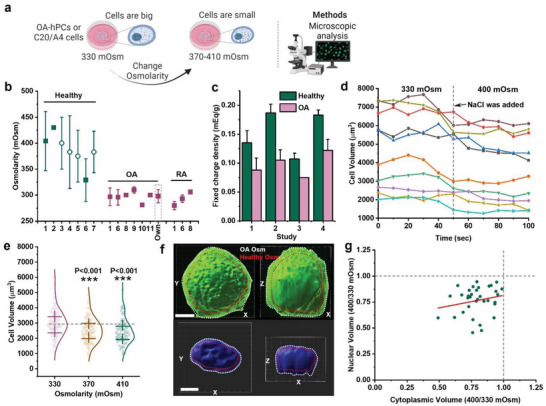
Figure 2.

Extracellular osmolarity controls cell size and volume. a) Schematic diagram showing that the cell size can be controlled through osmolarity and the methods used to investigate the cells size. b) Literature reports on osmolarities between healthy and diseased joints (Study 1,[ 2 ] 2,[ 21 ] 3,[ 22 ] 4,[ 23 ] 5,[ 19e ] 6,[ 24 ] 7,[ 25 ] 8,[ 26 ] 9,[ 27 ] 10[ 28 ] and 11[ 17b ] and our [own] measurements of osmolarity of synovial fluid from OA patients); Filled squares and open circles indicate osmolarity measurements from synovial fluid and cartilage tissue, respectively. c) Fixed charge density measurements of healthy and OA cartilage tissue (Study 1,[ 19c ] 2,[ 19d ] 3,[ 19b ] 4[ 19a ]). d) Timelapse imaging of chondrocytes cell size change between 330 and 400 mOsm, n = 10 cells. e) Change in C20/A4 cell size among 330, 370 and 410 mOsm (n > 100 cells, per condition). f) 3D confocal image shows the changes to cell and nuclear size as a cell is exposed to OA or healthy‐like osmolarity, scale bar 5 µm. g) A correlation graph shows the ratio of cytoplasmic and nuclear volume in OA hPCs as they were exposed to OA or healthy‐like osmolarity, n = 46. Statistics: e) Mann‐Whitney U‐test, ***p < 0.001, error bars/whiskers in b and e indicate SD and box in e indicate 25%, 75% percentile.
