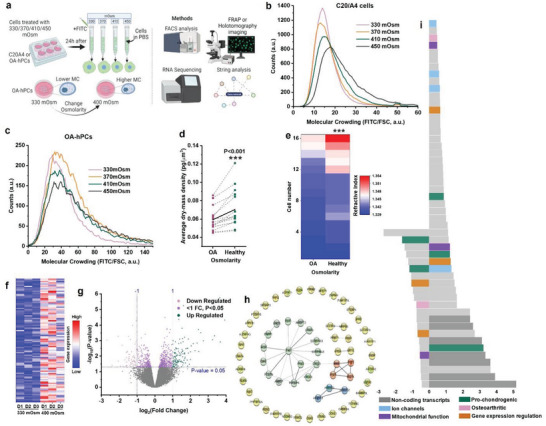
Figure 3.

Osmolarity regulates molecular crowding in hPCs with minimal impact on chondrogenic gene expression. a) Schematic diagram showing that molecular crowding changes within cells as the cell size is controlled by osmolarity and the methods used to investigate the changes to molecular crowding. Flow cytometry analysis of molecular crowding in b) C20/A4 and c) OA hPCs after culturing them in 330–450 mOsm media for 24 h, n > 5000 cells, per condition. d) Average dry‐mass density of same OA hPCs exposed to OA and healthy‐like osmolarities (330 and 400 mOsm, respectively) simultaneously. Black line in the middle indicates the mean. Measured using holo‐tomography microscopy, 3 donors, n = 16 cells. e) Refractive index of a same OA hPC cell at 330 and 400 mOsm as measured by holotomography microscopy. 3 OA donors, n = 16 cells. f) heat‐map shows top‐100 differentially expressed genes (DEGs) in hPCs exposed to 400 mOsm as compared 330 mOsm. N = 3 OA and 3 healthy donors. g) volcano plot showing DEGs in hPCs exposed to 400 mOsm as compared 330 mOsm, n = 3 donors, per condition. h) STRINGdb network analysis shows biological processes impacted by osmolarity, colors indicate an individual network. i) stacked bar diagram showing top 100 DEGs in 400 mOsm as compared to 330 mOsm. Statistics: d,e) Paired t‐test, ***p < 0.001.
