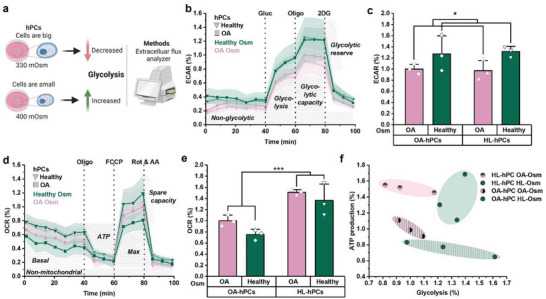
Figure 6.

hPCs with higher molecular crowding source their energy through glycolysis. a) Schematic showing the change in glycolysis in response to altered molecular crowding which was assessed with a metabolic flux analyzer (Seahorse XFe96). b) Extracellular acidification rate (ECAR) profile of the glycolysis stress test, c) Glycolysis (based on glycolysis stress test) d) Oxygen consumption rate (OCR) profile of the mitochondria stress test, e) Mitochondrial ATP‐production (based on mitochondria stress test), f) Comparing mitochondrial ATP production (mitochondria stress test) with glycolysis (glycolysis stress test) for healthy and OA hPCs in healthy or OA‐like osmolarity, Parameters are calculated from the metabolic profiling, and normalized to the OA hPCs in OA‐like osmolarity. n = 3 donors per condition, statistics: two‐way ANOVA, *p < 0.05, **p < 0.01, ***p < 0.001, shades in b and d and error bars in c and e indicate SD.
