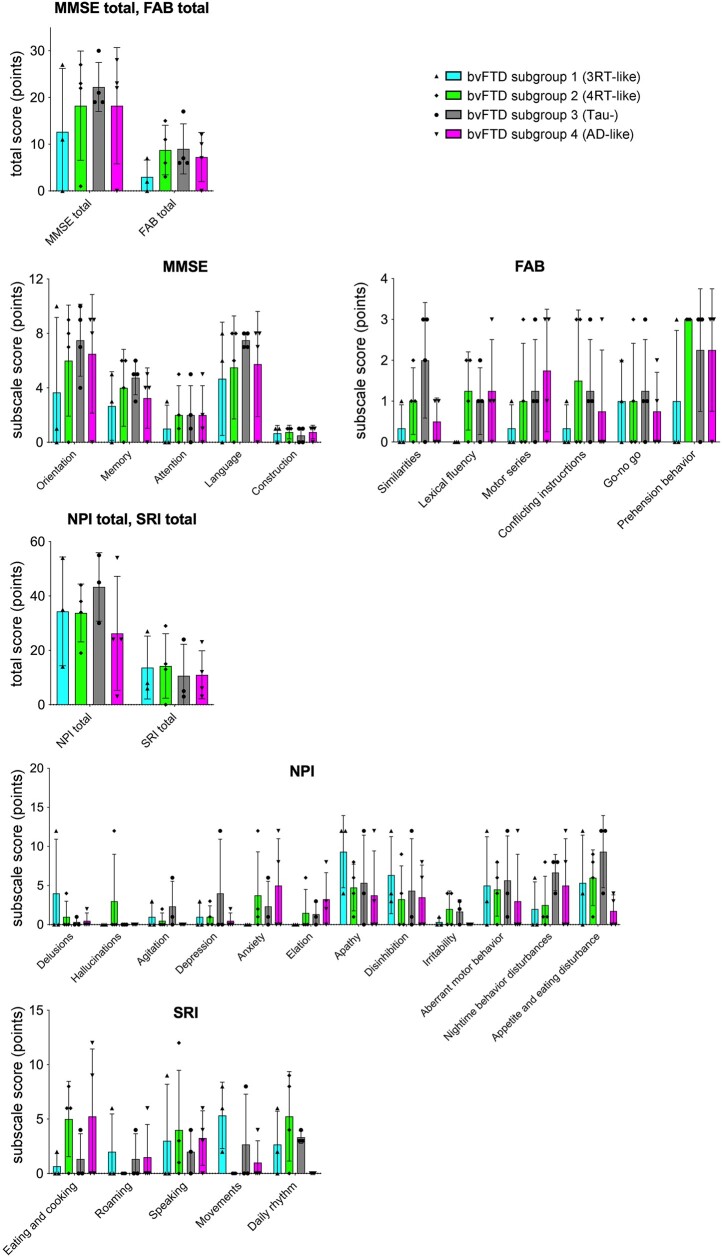
Figure 6.
Comparisons of clinical measures among PET-based neuropathological subgroups of bvFTD. By visual read and Z-score mapping of tau PET data, cases with bvFTD were classified into ‘3RT-like’ (Subgroup 1; n = 3), ‘4RT-like’ (Subgroup 2; n = 4), ‘tau-’ (Subgroup 3; n = 4) and ‘Alzheimer’s disease–like’ (Subgroup 4; n = 4) subgroups. Lower scores of MMSE and FAB indicate worse cognition or function, while higher scores of NPI and SRI indicate more severe symptoms. There were no significant subgroup differences in these clinical variables by the Kruskal–Wallis test. Solid symbols denote individual values. NPI and SRI data for one patient in Subgroup 3 are not available.

