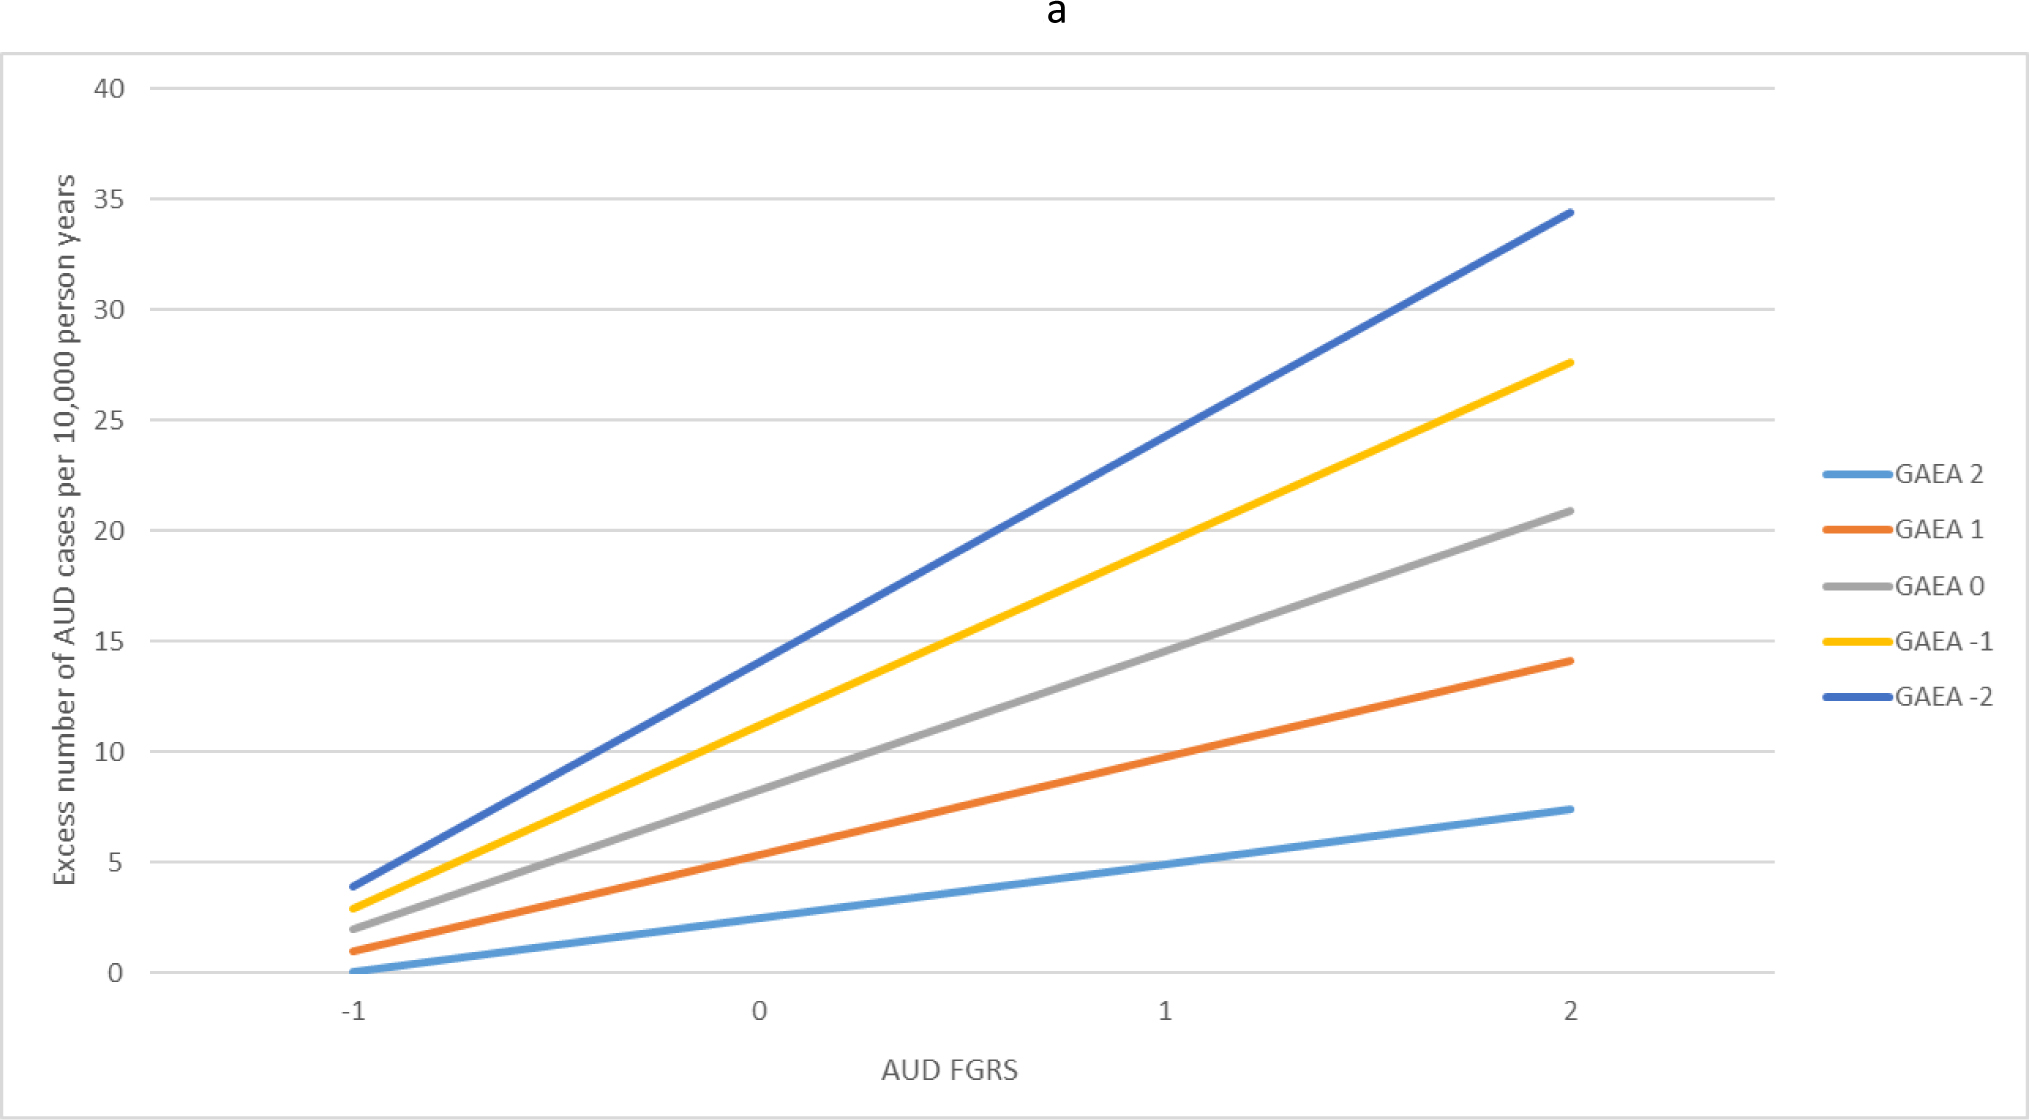
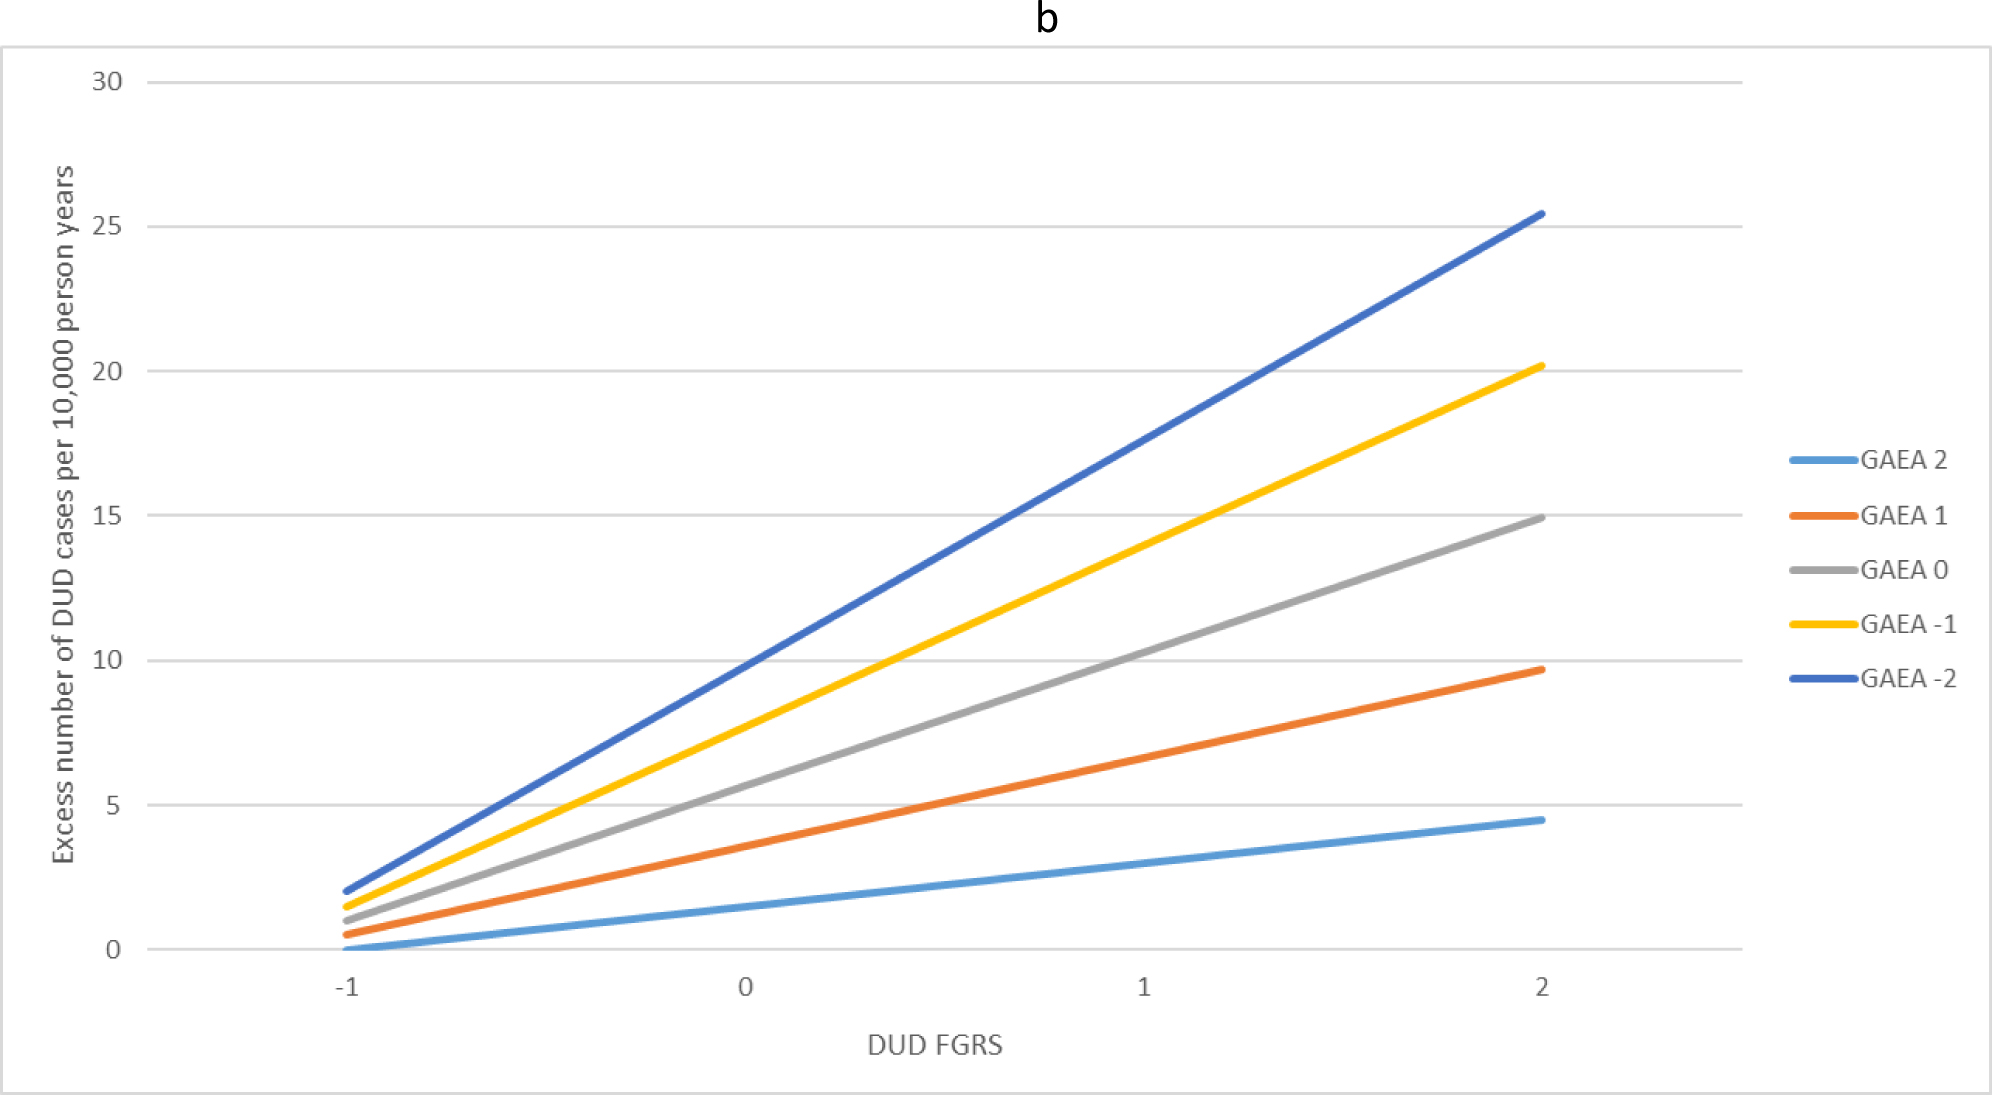
Fig. 1.


(a) The interaction effects in the prediction of alcohol use disorder (AUD) between the family genetic risk score for alcohol use disorder and the genetic aptitude for educational attainment. The x-axis is the level of the family genetic risk score for AUD in standard deviation units. The y-axis is the excess number of AUD cases predicted per 10 000 person years. The colored (grey-scale) lines reflect the level of the genetic aptitude for educational attainment in standard deviation units. For example, the light blue (very light grey) line at the bottom reflects a quite high genetic aptitude for educational attainment (+2 s.d.) while the dark blue line (very dark grey) at the top of the figure reflects a quite low genetic aptitude for educational attainment (−2 s.d.). (b) The interaction effects in the prediction of drug use disorder (DUD) between the family genetic risk score for DUD and the genetic aptitude for educational attainment. The x-axis is the level of the family genetic risk score for DUD in standard deviation units. The y-axis is the excess number of DUD cases predicted per 10 000 person years. The colored lines reflect the level of the genetic aptitude for educational attainment in standard deviation units. For example, the light blue (very light grey) line at the bottom reflects a quite high genetic aptitude for educational attainment (+2 s.d.) while the dark blue line (very dark grey) at the top of the figure reflects a quite low genetic aptitude for educational attainment (−2 s.d.).
