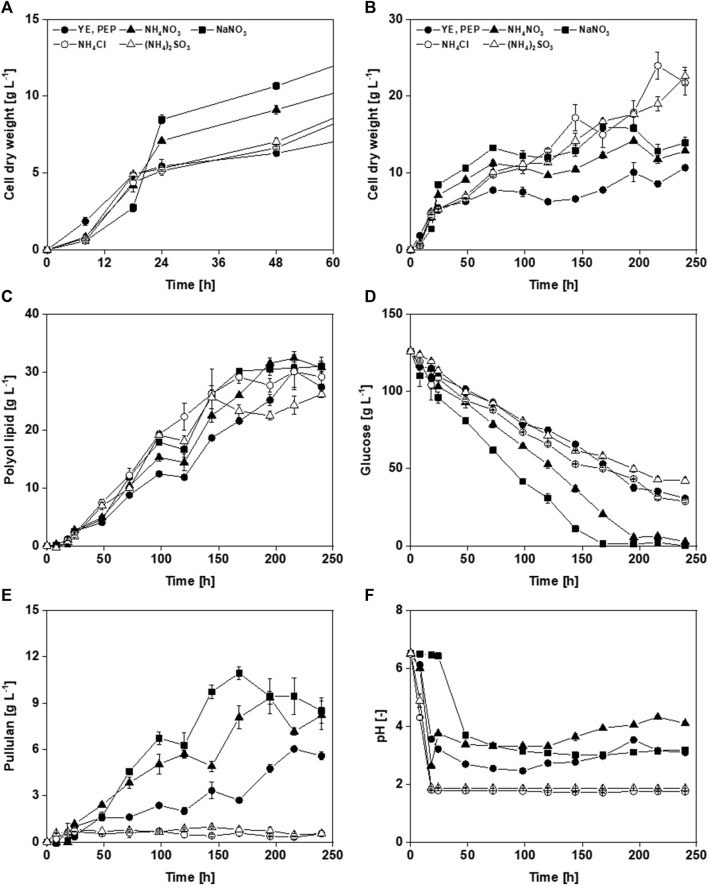
FIGURE 3.
Cultivation of A. pullulans NRRL 62042 with different nitrogen sources: Comparison of cell dry weight over the first 48 h (A), and 240 h (B), polyol lipid (C), glucose (D), pullulan (E), and pH (F) over time by using 126 g L−1 glucose and different nitrogen sources (0.9 g L−1 yeast extract (YE) and 1.5 g L−1 peptone (PEP), 2.01 g L−1 NaNO3, 1.56 g L−1 (NH4)2SO4, 1.27 g L−1 NH4Cl, or 0.95 g L−1 NH4NO3). Cultivations were performed with A. pullulans NRRL 62042 in 24 deep-well microtiter plates with 2 mL filling volume, 30°C, and 300 rpm. Data show the mean of triplicates with ±standard deviation.

